Products
Solutions
Resources
9977 N 90th Street, Suite 250 Scottsdale, AZ 85258 | 1-800-637-7496
© 2024 InEight, Inc. All Rights Reserved | Privacy Statement | Terms of Service | Cookie Policy | Do not sell/share my information

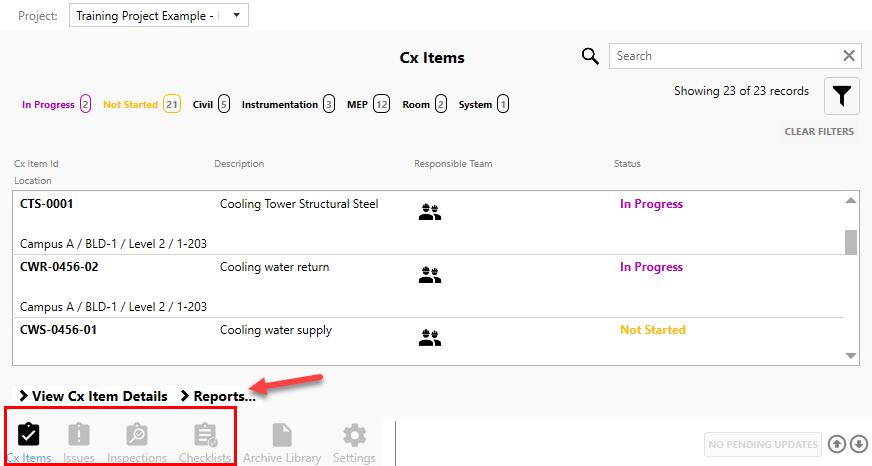
You can access Reports within InEight Completions. Depending on how your project administrator configured your system, you can find Reports by navigating to a tab, and selecting the Reports option. You can generate reports within tabs Cx items, Issues, Inspections, and Checklists modules.
After running an InEight Completions report, you can view the report output in Excel and/or PDF format.
|
Report Name |
Cx Items | Issues | Inspections | Checklists | Description |
|---|---|---|---|---|---|
| Excel Cx Item Overview | X | This report is consumed by project admins or management. This report is mostly used to view a full list of Cx item details and their phases, and to quickly track current status and accountability. | |||
| Excel Item Pivot Table | X | This is one of the more popular reports used by admins, management, owners users, etc. This is a quick way to visualize items progress, in a tabular color-coded view conditioned by status/date. This report includes basic Cx item information and an issue count summary. | |||
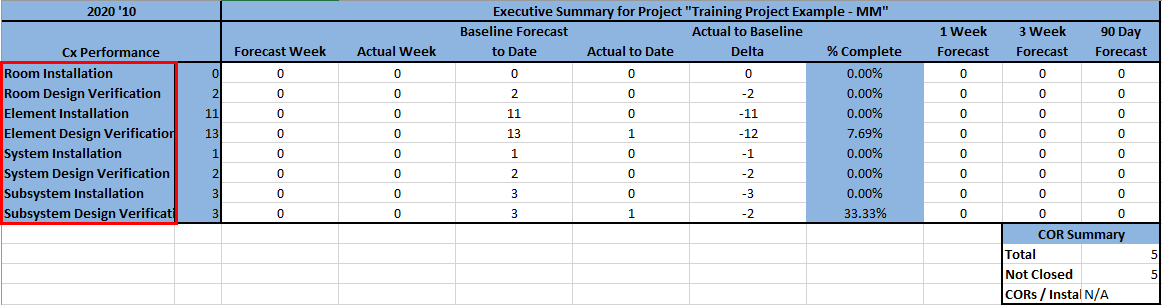
| Excel Item Executive Summary | X | This report is mostly used by management. Records are grouped by Cx item type and phases to compare counts between the estimate, forecast and actuals. This report is useful for measures like delta, percent complete, and look-ahead. | |||
| Excel Item Executive System Summary |
X |
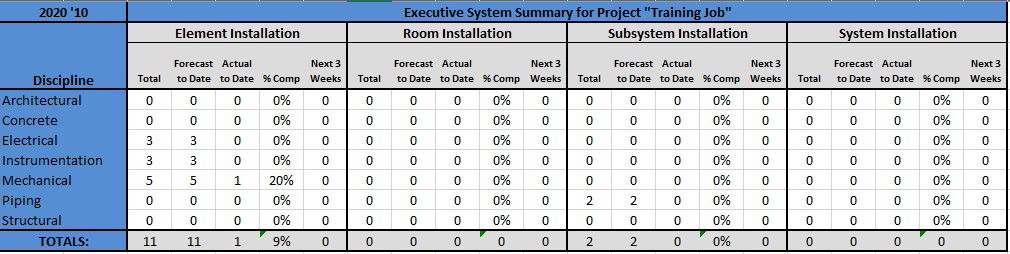
This report is mostly used by management. Records are grouped by disciplines, Cx item types and phases to compare between the estimate, forecast, and actuals. This report is useful for measures like delta, percent complete, and look-ahead. | |||
| Excel Plan vs Actual Type | X | This report is mostly used by management and owners. This reports the gap between planning and execution, per week. The accumulative lines are helpful visuals for evaluating performance. | |||
| Excel Issues per Phase | X | This report is mostly used by management and owners, and is used to measure the rate of issue creation vs. selected completion. | |||
| Excel Issue Overview |
X |
This Issues report displays a listing of Issues along with columns such as Status, Summary and Description. | |||
| Excel Inspection Overview | X | This Inspection report displays a listing of Issues along with columns such as Phase, Status, Summary and Description. | |||
| Generate PDF Report | X | X | X | X | This PDF report is used for final hand-overs. There are two ways to export this report: 1. a multiple detailed report only showing visible items, and 2. a summary showing items all within one report. This report can be customized per project needs. The PDF reports harvest all the data, links, and attachments and provide a final document. They also include QR scan codes that can be utilized in the field. |
The InEight Completions Reports are configurable, therefore the structure may vary from project to project.
PDF reports are based on option selections, and can be customized per your project needs. The PDF reports gather all the data, links, and attachments and provide a final document. They also include QR scan codes that can be utilized in the field.
When running any of the PDF reports at the header level, you have two options that allow you to:
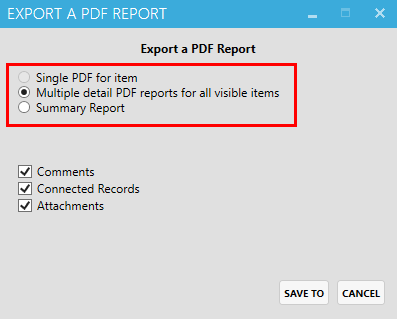
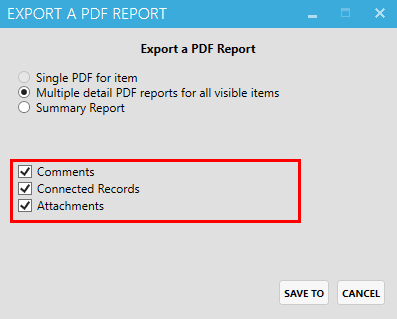
When running any of the PDF reports at the detail level, you have three options that allow you to show:
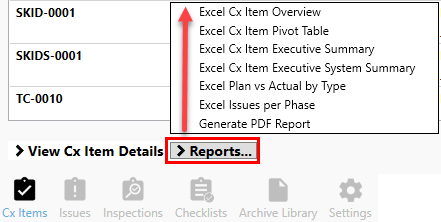
The Cx Item module reports can be found by navigating to Cx Items > Reports.
This report is mostly used to view a full list Cx item details and their phases, and to quickly track current status and accountability.
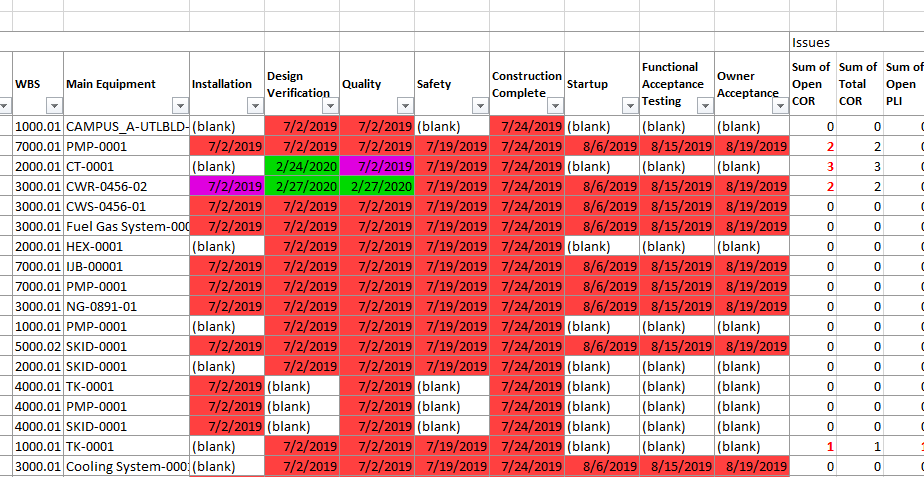
This is a quick way to visualize items progress, in a tabular color-coded view conditioned by status/date. This report includes basic Cx item information and an issue count summary.
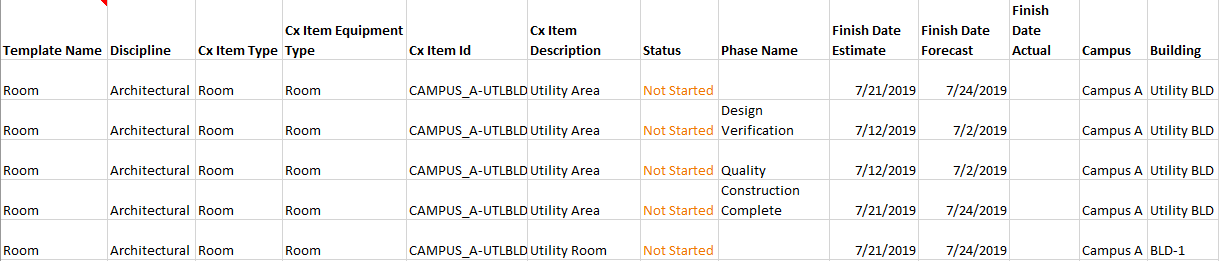
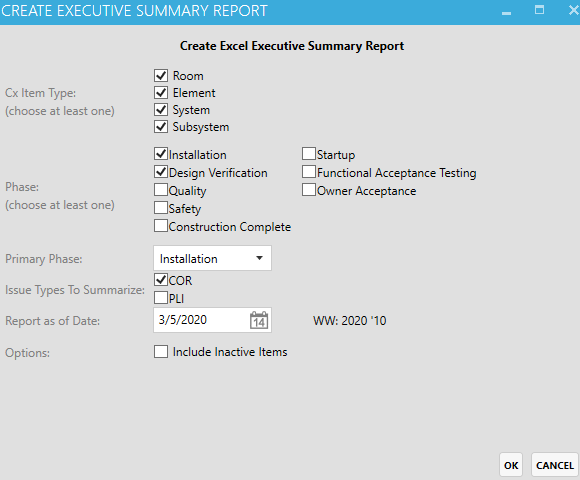
Records are grouped by Cx item type and phases to compare counts between the estimate, forecast and actuals. When this report is first selected, a Create Executive Summary Reportpop-up window appears. This is where you can make selections based upon what you want to see in your report.
Based upon the Installation and Design Verifications Phase selections made in the above pop-up window, only those you can see in the Installation and Design Verification phase types are shown in the report below.
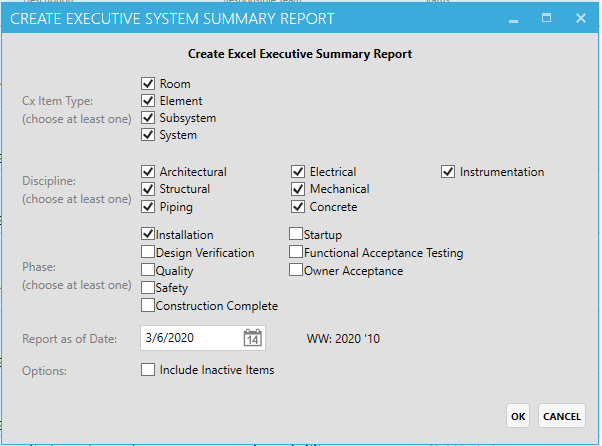
This report is mostly used by management. Records are grouped by disciplines, Cx item types and phases to compare between the estimate, forecast and actuals. When this report is first selected, a Create Executive System Summary Report pop-up window appears. This is where you can make selections based upon what you want to see in your report.
Based upon the Installation Phase selections made above, in the example below, you can see the data represented by Discipline in the report.
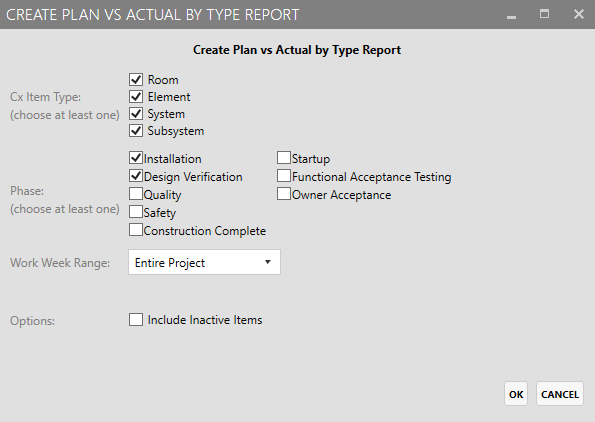
This report addresses the gap between planning and execution, per work week. The accumulative lines are helpful visuals for evaluating performance. When this report is first selected, a Create Plan vs Actual by Type Report pop-up window appears. This is where you can make selections based upon what you want to see in your report.
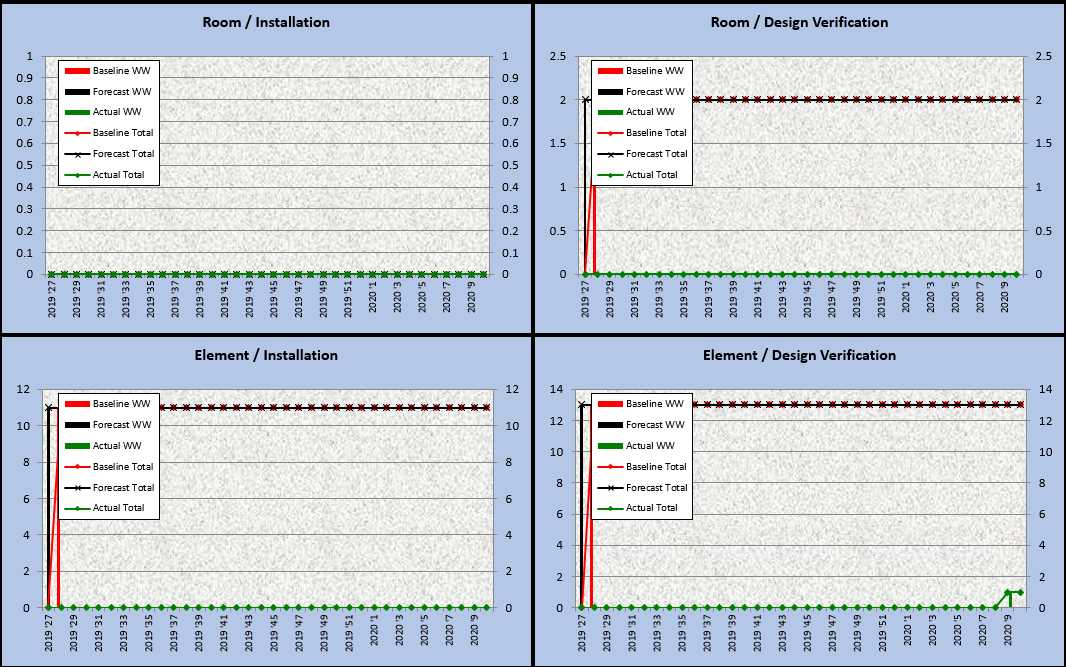
Based upon the selections made in the above pop-up window above, you can see the chosen results in the below report.
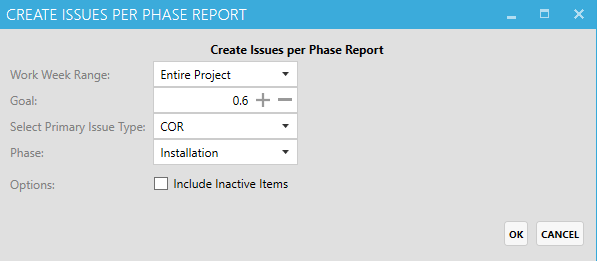
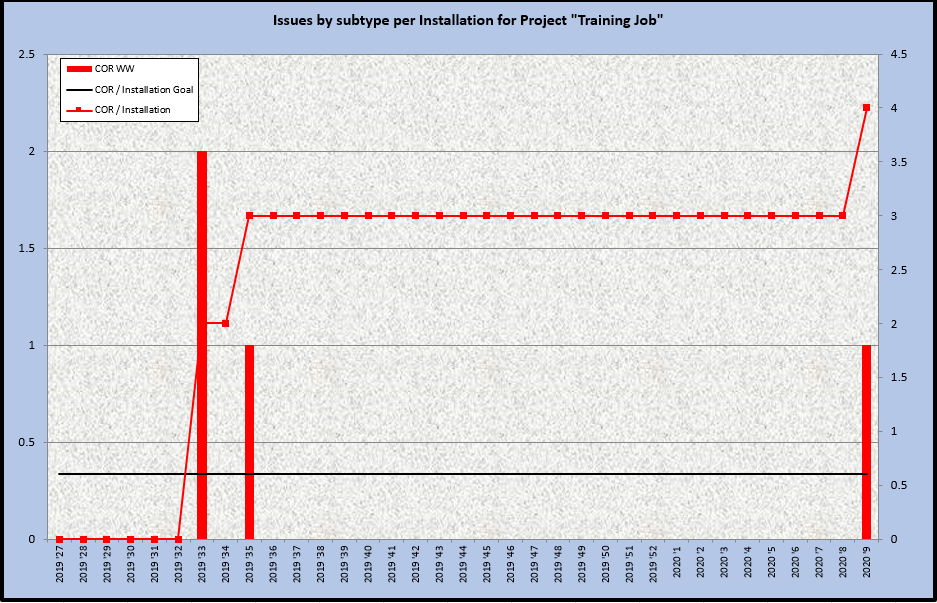
This report is used to measure the rate of issue creation vs. selected completion. When this report is first selected, a Create Issues per Phase Report pop-up window appears. This is where you can make selections based upon what you want to see in your report.
Report results are shown below.
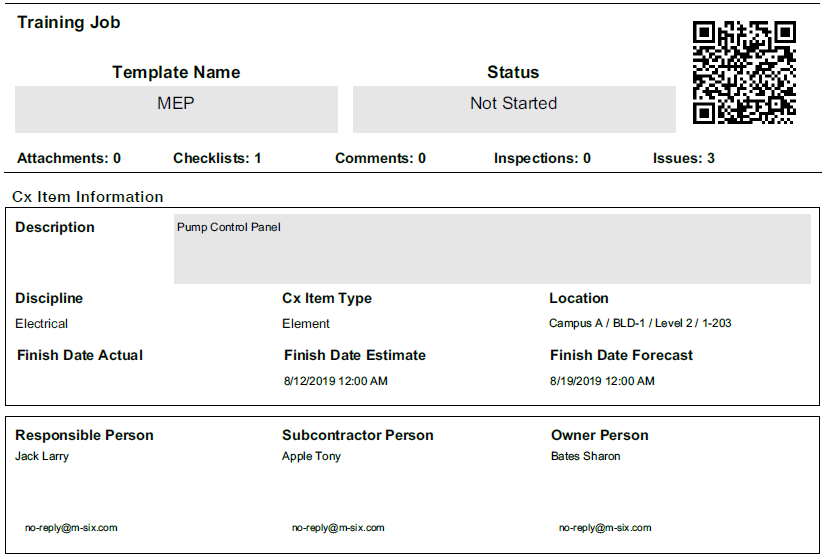
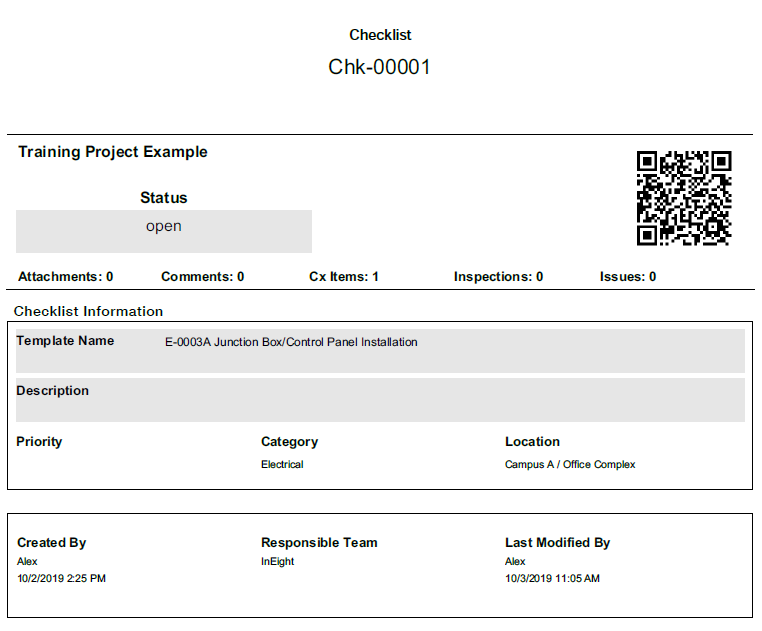
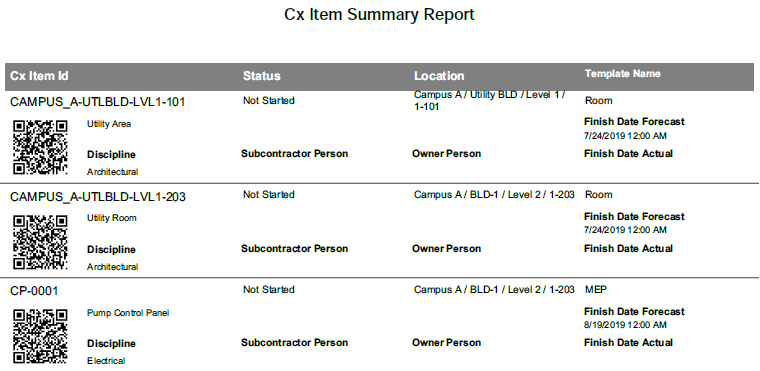
The (Cx) Generate PDF report is summary of a Cx item that displays information such as the number of Attachments, Checklists, Comments, Inspections, and Issues. A QR scan code is also included, to be utilized in the field. While the example below is for Cx Items, the same sort of PDF Report is available in the Issues, Inspections, and Checklists modules.
The Issues report module can be found by navigating to Issues > Reports
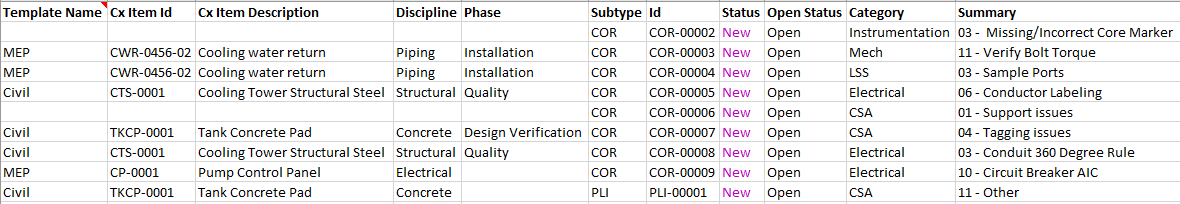
This Issues Overview report displays a listing of Issues along with columns such as Phase, Status, Category, Summary and Description.
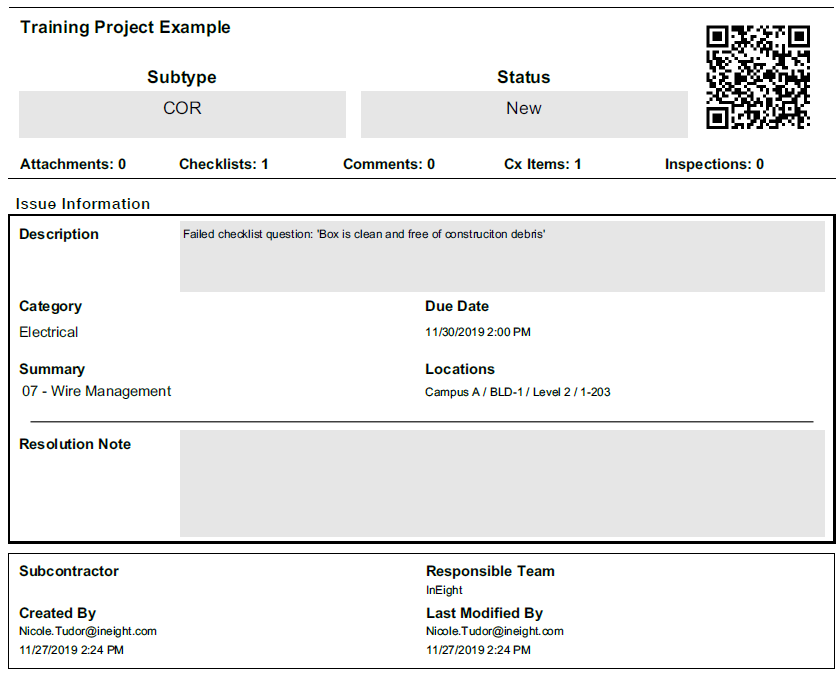
The (Issues) Generate PDF Report is a summary of an Issue that displays information such as Attachments, Checklists, Comments, Cx Items, Issues, and Issue Description. A QR scan code is also included, to be utilized in the field. While the example below is for Issues, the same sort of PDF Report is available in the Cx Items, Inspections, and Checklists modules.
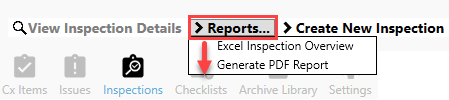
The Inspections module reports can be found by navigating to Inspections > Reports.
The Excel Inspection Overview report displays Inspection ID's along with columns such as: Status, Description, Created By and the various Inspection locations.

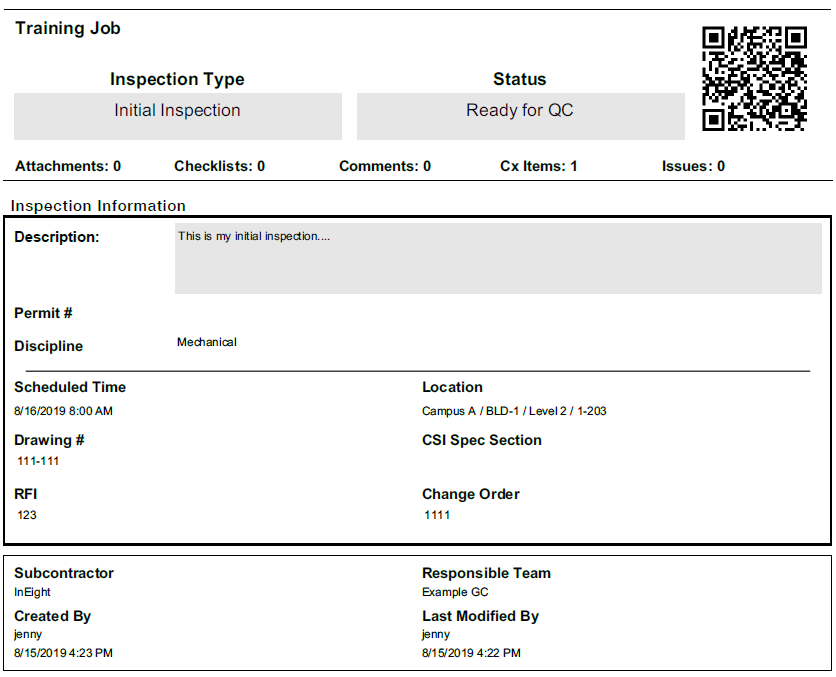
The (Inspection) Generate PDF report is a summary of an inspection that displays information such as: Attachments, Checklists, Comments, Cx Items, Issues, and Inspection Description. A QR scan code is also included, to be utilized in the field. While the example below is for Inspections, the same sort of PDF Report is available in the Cx Items, Issues and Checklists modules.
The Checklists module reports can be found by navigating to Checklists > Reports.
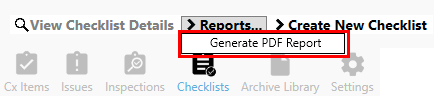
The (Checklists) Generate PDF report is a summary of an inspection that displays information such as Attachments, Checklists, Comments, Cx Items, Issues, and Checklist Description. A QR scan code is also included, to be utilized in the field. While the example below is for Checklists, the same sort of PDF Report is available in the Cx Items, Issues and Inspections modules.
The following Step by Step walks you through how to execute a PDF Summary Report within a tab menu path.
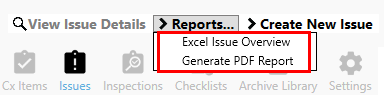
Using the Cx Items module as an example, follow the Step by Step instructions below to run the Generate PDF Report.
Additional Information
9977 N 90th Street, Suite 250 Scottsdale, AZ 85258 | 1-800-637-7496
© 2024 InEight, Inc. All Rights Reserved | Privacy Statement | Terms of Service | Cookie Policy | Do not sell/share my information