Standard dashboards
To access dashboards from the Main menu, click Explore, and then select Dashboards.
You do not have to be signed in or assigned to a particular project to access Explore. Explore is a separate application from those used in any given project and is available to all users in an organization that have been assigned the applicable role or permissions. The information provided in Explore is not in real time for any given project.
There are multiple out-of-the-box dashboards available in Explore with each having its own refresh schedule, which is determined by the product groups.
|
Dashboard
|
Description
|
|
Change
|
Allows you to manage the history of project changes, their associated costs, and the conversion of issues into change orders for both owners and subcontractors. Provides early visibility into potential changes, allowing you to begin an audit trail before changes impact the project. Features include capturing issue details (name, description, start date, source/cause, scope, client notification), tracking issues, converting them to Potential Change Orders (PCOs) and Client Change Orders (CCOs), and supporting legal documentation.
|
|
Change Issue
|
Provides insights into project changes and allows project teams to see the different stages of these changes that are initiated as Issues to become PCOs (Potential Change Orders), and then CCOs (Client Change Orders). All the relevant metrics about Issues, PCOs, and CCOs are shown with the ability to filter the data down by organization, project, and date range. The data in this dashboard is sourced from InEight Change to help you understand trends over time, counts, and values associated to contract changes.
|
|
Connected Analytics Index
|
Provides a catalog of all reporting items contained in Report, Explore and Replicate. This dashboard helps you locate the specific data fields in InEight Reporting APIs and provides updated schema information for each Explore and SelfService API, and Replicate view when your environment upgrades to a new release.
|
|
Connected Analytics Utilization
|
Provides metrics to show utilization by users over time that helps to identify level of engagement with InEight Report and Explore applications. Also provides information on the functionality of the reports that were run.
|
| Contract |
Allows you to track your contracts throughout the entire contract lifecycle and provides a single focal point where you can manage contracts and drive action where it is needed. This dashboard can also be launched directly from the Actions menu in InEight Contract. |
| Control Audit |
Allows you to track the changes that occurred in the CBS, ACS, Pay Items, and Change Register pages in InEight Control. In the dashboard, you can see who made changes, the items that were changed, and the value amounts in the change. Information captured in the dashboard also lets you see when a sync between Control and external systems was performed. |
| Core Project |
Provides a comprehensive overview of platform-level items, including organizations, projects, roles, permissions, user role assignments, and logins. This dashboard also provides insights into utilization of each InEight application in the cloud platform by showing the total number of main objects such as the total issue count in Change or cost items in Control. |
| Design |
This dashboard brings together planning, progress, productivity, resource, and quantity insights into one consolidated reporting experience. The dashboard enables Engineering teams and project leaders to quickly understand how design is progressing, whether teams are performing efficiently, where work is ahead or behind, how resources are being utilized, and what scope and deliverables remain. See the Design Dashboard Overview video for more information.
|
| Estimate Portfolio |
Provides an in-depth, consolidated view of your entire estimate portfolio and covers a wide range of InEight Estimate SaaS product features and functionality. See the Estimate Portfolio Dashboard video for more information. |
| Field Execution |
A productivity centric dashboard that offers a comprehensive analysis on field performance. Metrics ranging from Progress Curves, Planned vs Actual, Daily Gain/Loss, Cost/Hours Productivity, Crew Performance, Timesheet Exceptions, Issues and more are available to help identify bottlenecks and proactively make informed decisions to mitigate deviations from project budget. The Time Intelligence filters such as Next Week, Next 3 weeks or Next Month provide users the ability to see future productivity targets, which helps with resource planning. See the Field Execution Dashboard video for more information. |
| Model Tracked Issue |
This dashboard highlights Issues captured in InEight Model, enabling effective management and prioritization. It provides key details such as due dates, responsible parties, categories, and more to streamline issue resolution. |
| Package Milestone |
Allows you see information about user-defined milestones in the procurement process over time. Also provides detailed bid package information at the line item level with the ability to link back to InEight products. |
| Portfolio |
Consolidating data from multiple InEight applications, this dashboard helps you understand how your projects are progressing and identify areas that might need attention sooner rather than later. The dashboard highlights key metrics and data for your project from Control, Contract, Change, Plan, Progress, and Platform, and shows it in one centralized location. From this information, you can understand the overall health of your projects or utilize this dashboard to compare across milestones. |
| Project Controls |
An earned value-centric dashboard that provides a detailed and holistic view of budget performance. This dashboard encompasses all key Earned Value metrics, including budgets, estimates, forecasts, actuals, revenues, changes, and resources that provide valuable insights to help track and manage financial performance throughout the project lifecycle. By visualizing these metrics in one place, the dashboard lets teams assess trends, identify variances, and make data-driven decisions to maintain control over costs and resources. This dashboard also facilitates a Data Integrity Health Check, pinpointing exceptions and inconsistencies—an essential feature for maintaining robust and reliable cost management within InEight Control. |
| Schedule |
Provides comprehensive insights into project schedules, offering detailed activity and schedule comparisons, float trend analysis, and resource utilization tracking. It includes high-level risk and opportunity overviews, deeper analyses of threats and mitigations, and a centralized event register. With industry-standard schedule quality metrics and tools to evaluate mitigation efforts, this dashboard ensures users can trust their data while identifying risks, opportunities, and areas requiring attention across progress updates or what-if scenarios. |
Dashboard refresh
On the Dashboard page, a manual refresh option shows in the dashboard menu for users with the permission Refresh Dashboard datasets (Suite administration > Roles and permissions >Explore > Dashboards). This allows administrators to manage the roles that can perform manual updates and allows users to refresh dashboard datasets without having to leave the Explore application. See Refresh dataset for more information about manual refresh.
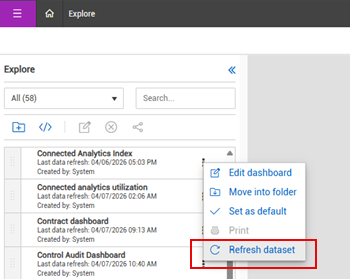
To ensure optimal system performance and stability, there are set global limits for refreshing dashboard datasets that are enforced across all tenants.
-
Daily cap: Users are limited to refreshing five times per dashboard, including any custom dashboards, within a 24-hour period.
-
Cool-down period: A 30-minute wait is required between consecutive refresh requests to prevent system overload.
Dashboard management
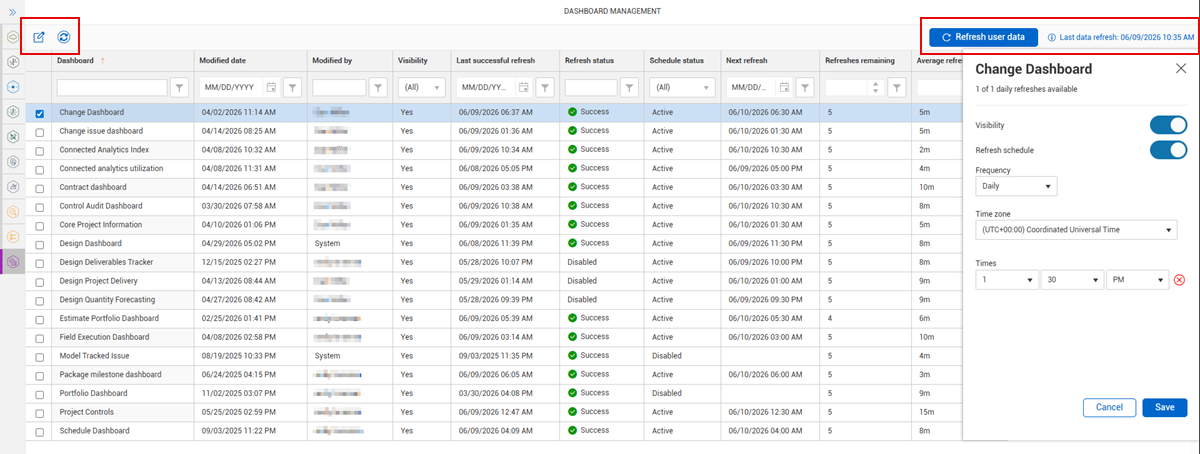
This Explore settings page lets administrators show and hide dashboards at the organization level, set and control the dashboard refresh schedule, and initiate a dashboard dataset refresh on demand. You must have the role of Organization Admin (or higher) and the required permissions to view and access the Dashboard Management page.
To open the Dashboard Management page for an organization, in the Main menu select the organization, and then go to Settings > Explore > Dashboard Management. The page opens and shows a list of all the standard dashboards and the status for each of them.
The Refresh user data button lets an administrator initiate a refresh of user data in the background for new Explore users or users with new dashboard permissions, which allows them to access the dashboards right away. Otherwise, users must wait for the overnight refresh to complete (shown as Last data refresh) for the changes to take effect.
On the page the list shows dashboard visibility, scheduled refresh status, and manual refresh status. Select a dashboard from the list to enable the Edit dataset settings and Refresh dataset icons.
Edit dataset settings
When you click the Edit dataset settings icon, it opens a slide-out panel for the dashboard where you can do the following:
-
Set to show or hide the dashboard for the organization
-
Enable and configure the dashboard refresh schedule
-
Disable the refresh schedule
Use the average refresh time to help when adjusting schedules to avoid having multiple dashboards refresh at the same time. Most dashboards can only be scheduled to refresh once per day.
Refresh dataset
The Refresh Dataset icon is also enabled when a check box is selected, which lets you initiate a manual ad-hoc refresh for the selected dashboard. The Refreshes remaining column shows the number of manual refreshes available for the day. A maximum of five refreshes is allowed per day, per dashboard.
-
Refresh actions are controlled by system rules such as daily limits, cooldowns, and scheduling. Dialog boxes show a message based on the following scenarios:
-
Eligible (outside cooldown, refreshes available): Prompts you to confirm the refresh and shows remaining count.
-
Dataset currently refreshing: Refresh blocked
-
Within 30-minute cooldown: Refresh temporarily unavailable
-
Daily limit reached (5/5): No further refreshes allowed
-
Scheduled refresh within 30 minutes: Refresh blocked until schedule completes