Products
Solutions
Resources
9977 N 90th Street, Suite 250 Scottsdale, AZ 85258 | 1-800-637-7496
© 2024 InEight, Inc. All Rights Reserved | Privacy Statement | Terms of Service | Cookie Policy | Do not sell/share my information

In addition to the incremental curve, you also have a cumulative curve. This is also known as the S-curve. If you toggle the S-curve On, you can see two S-curves are planned on the histogram.
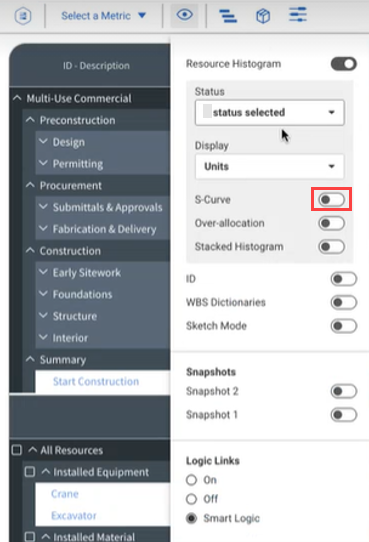
Use the following step by step to enable the S-curve in the Resource histogram.
In the toolbar, click the View options icon.
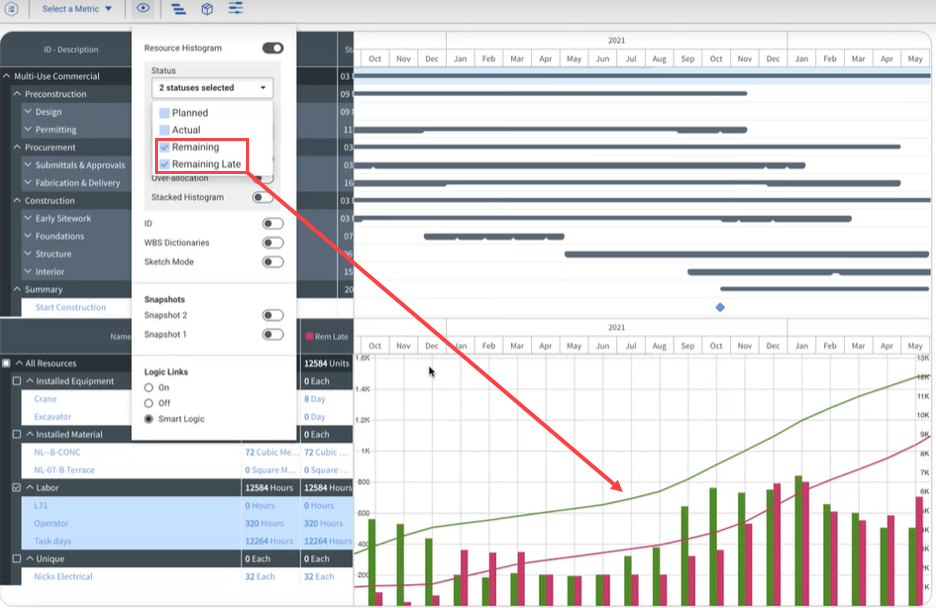
Select the Status drop-down menu, and then select Remaining and Remaining Late.
Switch the S-curve toggle to enable the S-curve.
Two S-curves show on the histogram. At the conceptual phase of a project, you are shown these early and late dates. The space between those curves is the float on the project.
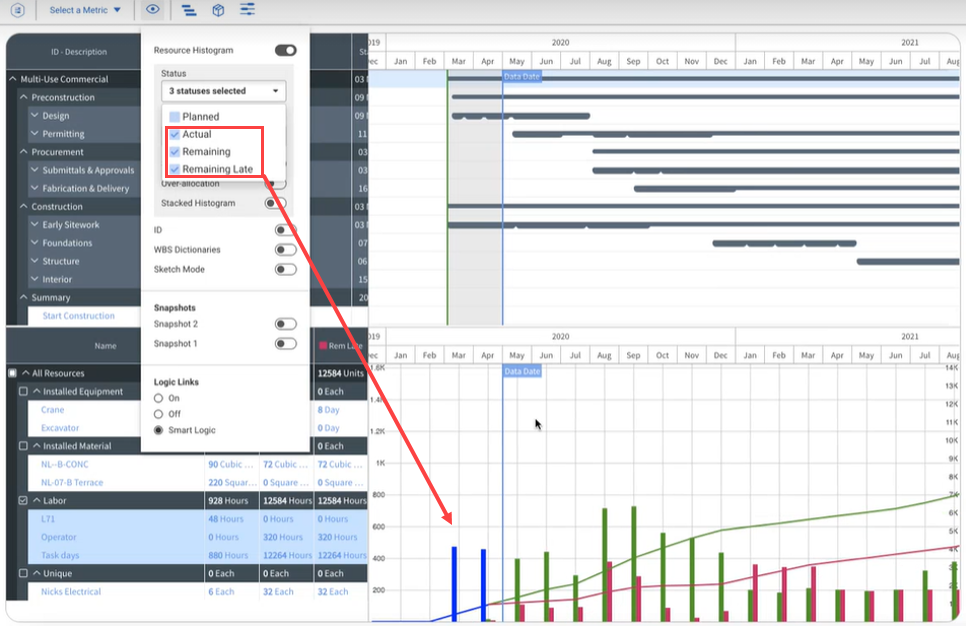
With the Actual status enabled with the S-curve lines, you can see that the Actual line ends where the Remaining Late and Remaining lines start. This is your job to date running total for the project. For example, you had certain man-hours earned to date and the remaining hours to earn start from what you have earned to date. You started from the Actuals line in blue and then you go forward from there. The Actual line end where remaining units begin. The Remaining and Remaining late lines starts where actuals for the project end.
Additional Information
9977 N 90th Street, Suite 250 Scottsdale, AZ 85258 | 1-800-637-7496
© 2024 InEight, Inc. All Rights Reserved | Privacy Statement | Terms of Service | Cookie Policy | Do not sell/share my information