Products
Solutions
Resources
9977 N 90th Street, Suite 250 Scottsdale, AZ 85258 | 1-800-637-7496
© 2024 InEight, Inc. All Rights Reserved | Privacy Statement | Terms of Service | Cookie Policy | Do not sell/share my information

The Analysis View template works alongside the snapshots. This view lets you bring in new columns from SN1 Actual Finish to the additional variance columns. These columns are used in snapshots to compare information between snapshots and the current project. This template includes anything with a snapshot or a variance.
The following step-by-step walks you through how to select the Analysis View template.
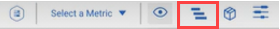
In the toolbar, select the Select View Template icon.
In the Current Template field, select the blue icon on the right. A drop-down menu opens.
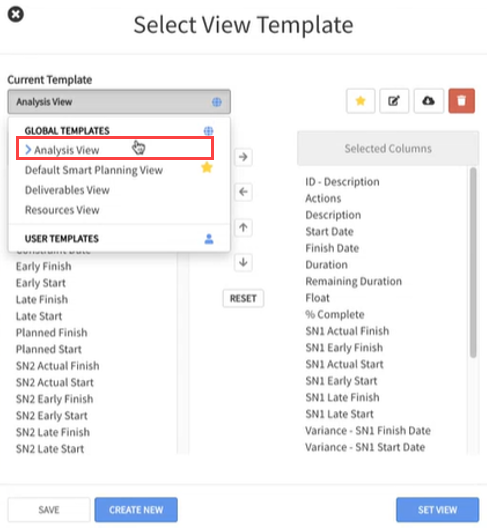
Under Global Templates, select Analysis View.
Columns that are available for viewing snapshot changes are available in this template. You can also add any available columns to the template as needed.
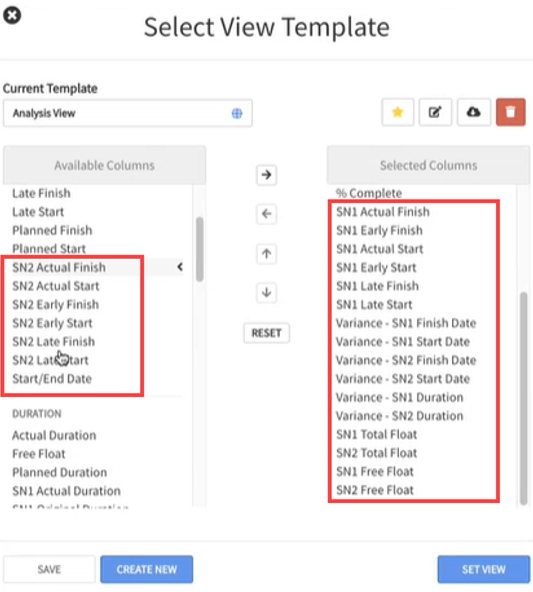
Use the arrows to move the columns over to the Selected Columns column as needed.
After the Analysis View template has been edited, select Set View to add the columns to the Gantt chart.
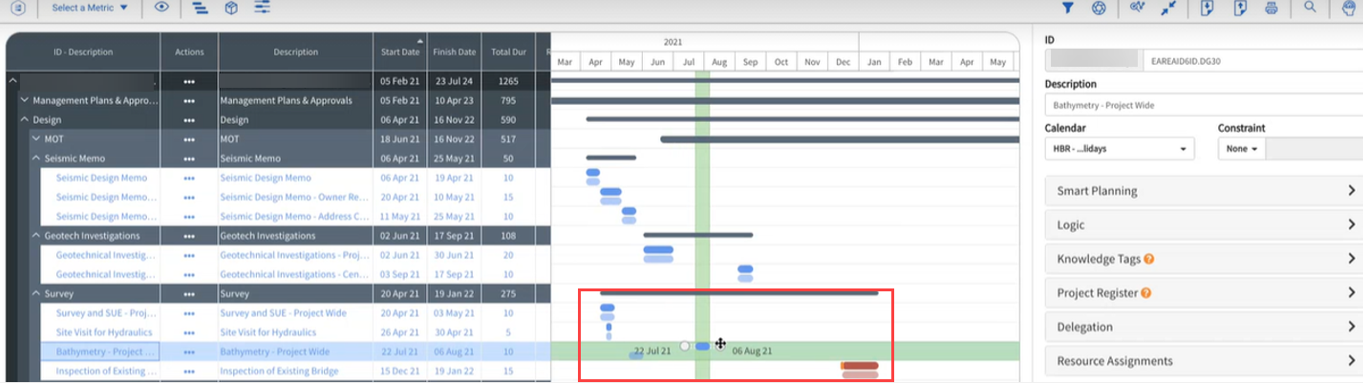
After the snapshot has been created, your Gantt chart is updated with bars for the information that relates to the current schedule status and the snapshot status. The darker bars can be moved to change the schedule on the Gantt Chart. The lighter bars represent the snapshot. The bars are blue when the schedule is not critical and red if they are critical.
The following step-by-step walks you through how to view existing snapshots on the Gantt Chart.
In the toolbar, select the View options icon.
Under the Snapshots section, select the slider for the snapshot you prefer to see in the Gantt chart. A drop-down menu opens.
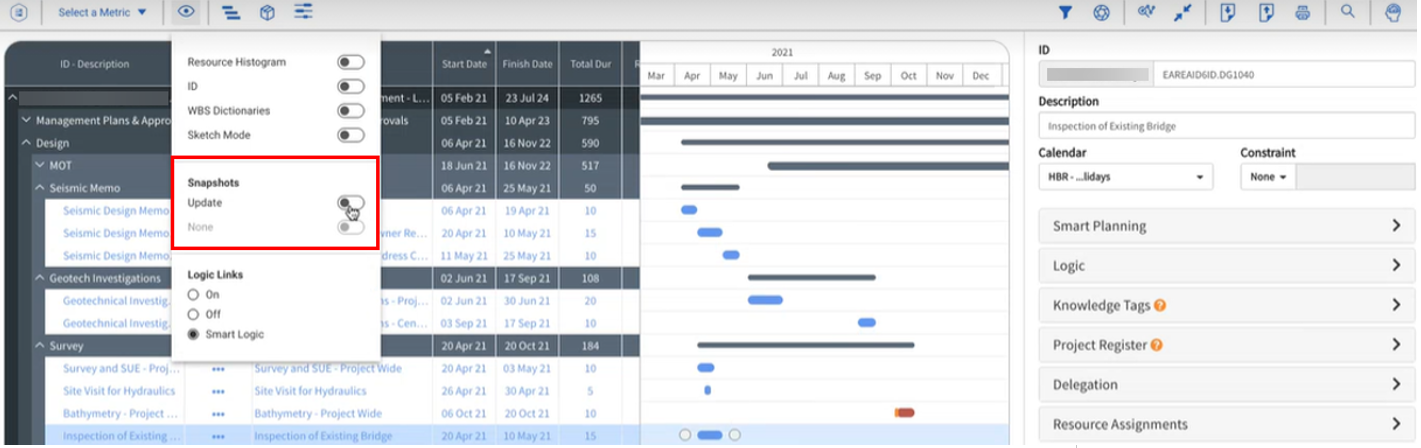
Two bars now show for items in the Gantt chart. You can move around the darker blue or darker red bars. The lighter bars represent the information saved in the snapshot and cannot be moved.
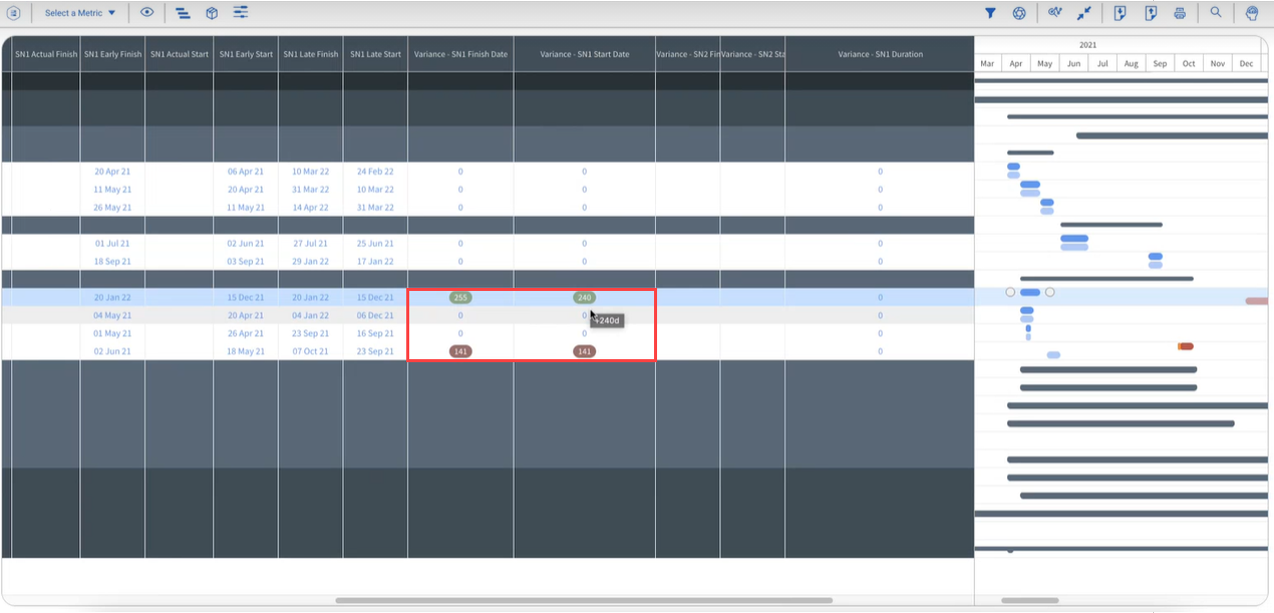
Each variance column compares the snapshot to the current project.
The columns show a badge depending on how the information changed. If there is a net zero change, then no badge appears. For example, the variance columns might show a green badge number if there is a decrease in duration between the snapshot and the current project. The badge numbers could also show in red if the duration increased between the snapshot and the current project. If there is no change between the snapshot and project, the number shows as 0.
Additional Information
9977 N 90th Street, Suite 250 Scottsdale, AZ 85258 | 1-800-637-7496
© 2024 InEight, Inc. All Rights Reserved | Privacy Statement | Terms of Service | Cookie Policy | Do not sell/share my information