Products
Solutions
Resources
9977 N 90th Street, Suite 250 Scottsdale, AZ 85258 | 1-800-637-7496
© 2024 InEight, Inc. All Rights Reserved | Privacy Statement | Terms of Service | Cookie Policy | Do not sell/share my information

On your job, from the Estimate tab, select Setup >Job Properties >Cash Flow.

The default options show automatically. You can adjust the default option.
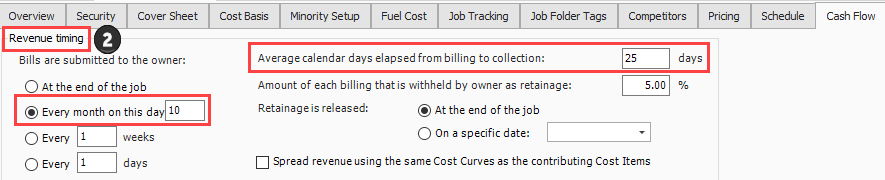
You can change your Revenue timing. For example, you can change to Every month on the 10th.
The average calendar days from billing to collection should be set to 25 days
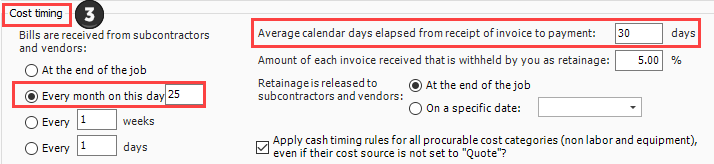
For Cost timing, bills are received from subcontractors and vendors Every month on the 25th.
Average calendar days elapsed from receipt of invoice to payment should be set to 30 days
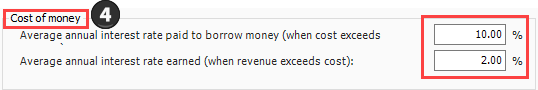
You can update the Cost of money values. For example, you can enter 10% for the Average annual interest rate paid to borrow money (when cost exceeds revenue) and 2% for Average annual interest rate earned (when revenue exceeds cost).
You have the option of updating all other values or leave the default values. .
In the E101 – Training Job, from the Estimate tab, select Cash Flow from the Schedule section.
On the Actions tab, select Display Settings  to open the Display Settings window.
From the Period drop-down list, select Week.
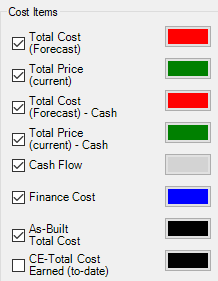
Under the Cost Items section, make sure the following are selected:
Total Cost (Forecast)
Total Price (Forecast)
Total Cost (Forecast) – Cash
Total Price (Forecast) – Cash
Cash Flow
Finance Cost
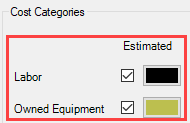
Under the Cost Categories section, check the Estimated checkbox for the Labor and Owned Equipment categories.
Click OK to close the Display Settings window.
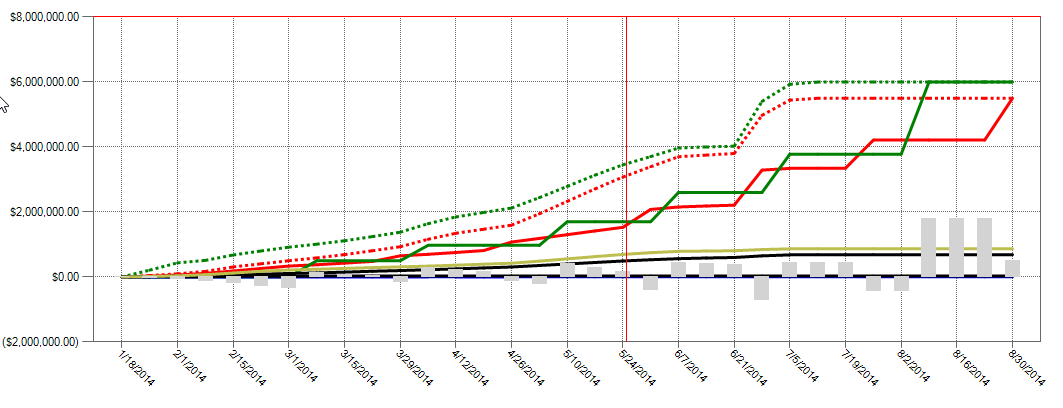
Your Total Cost (Forecast) displays as a dashed red line, indicating your accrued costs based on when your cost items are scheduled and the assigned cost curves for each cost item.
Your Total Price (current) displays as a dashed green line, indicating the revenue you’ve earned, based on the timing of your pay items
Your Total Cost (Forecast) – Cash displays as a solid red line, indicating your costs, based on when your cost items are scheduled and the cost timing defined in Cash Flow Options
Your Total Price (current) – Cash displays as a solid green line, indicating your revenue, based on the timing of your pay items and the revenue timing defined in Cash Flow Options
Your Cash Flow displays grey bars indicating when your cash flow is negative or positive
Your Finance Cost displays as a blue line on the graph
To filter your graph by date range, click on the Start drop-down arrow  and select a start date of your date range filter.
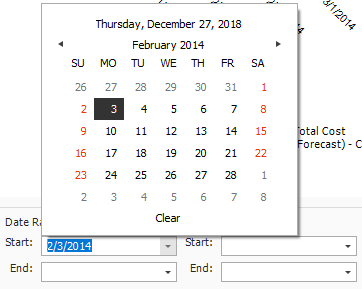
Click on the End drop-down arrow and select an end date of your date range filter.
Your graph now only includes your cost items that fall within the specified date range
To remove the filter, click in the Start field and press the Backspace key.
Do the same for the End field.
In the E101 – Training Job, from the Estimate tab, select CashFlow from the Schedule section.
On the Actions tab, select Display Settings to open the Display Settings window.
Make sure the all checkboxes are unchecked under the Cost Items and Cost Categories sections.
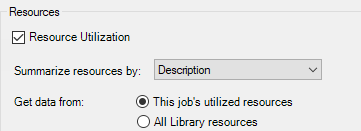
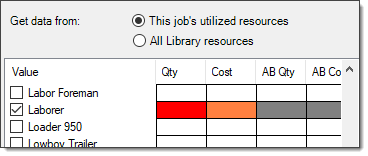
Under the Resources section, check the Resource Utilization checkbox.
From the Summarize resources by drop-down list, select Description.
From the resulting list of Values, select Laborer.
Click in the Qty field for the selected value and select a color of your choice.
In this case the Qty represents the work hours for your Laborer resource
Click in the Cost field for the selected value and select a different color of your choice.
From the Quantity and Cost drop down lists, you can select how your quantities and costs will display on the graph. In this case select the Quantity to show as a Bar and Cost to display as a Line.
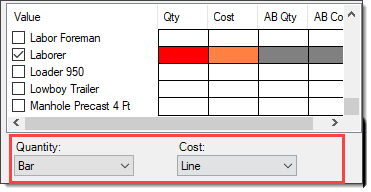
Click OK to close the Display Settings window.
The graph now shows the utilization of your Laborer resource, showing the work hours and costs used over time
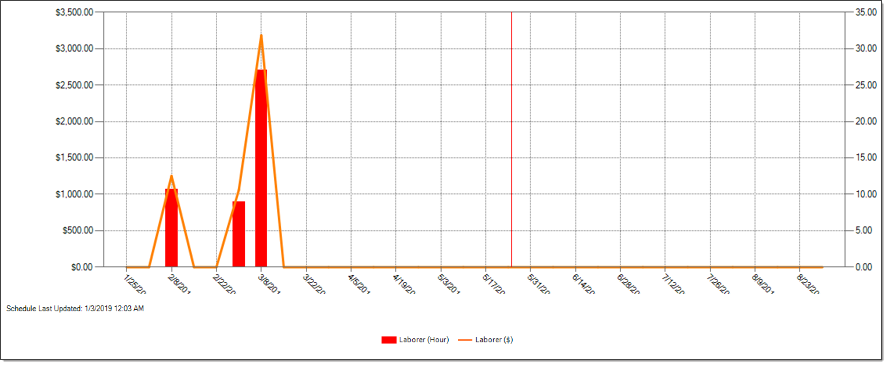
The graphs shown on the Cash Flow form are based on the estimated cost of each cost item and its resource employments (in the case of resource utilization).
Additional Information
9977 N 90th Street, Suite 250 Scottsdale, AZ 85258 | 1-800-637-7496
© 2024 InEight, Inc. All Rights Reserved | Privacy Statement | Terms of Service | Cookie Policy | Do not sell/share my information