Products
Solutions
Resources
9977 N 90th Street, Suite 250 Scottsdale, AZ 85258 | 1-800-637-7496
© 2024 InEight, Inc. All Rights Reserved | Privacy Statement | Terms of Service | Cookie Policy | Do not sell/share my information

Benchmarking is used to validate an estimate's cost and productivity values by comparing them to relevant historical data, specifically as-built and as-estimated information captured from past jobs in Estimate. Unit cost and unit man-hour benchmark data points are displayed graphically in relation to the current estimate.
When using the Estimate in the Cloud benchmarking feature, it requires the installation of Connected Analytics.
The Master Job Properties - Benchmarking form is used to establish the historical data to be used for benchmarking the current job, and to define the default benchmark graph display and calculations.
The Master Job Properties - Benchmarking form includes:
The data in the Master Job Properties - Benchmarking form is automatically copied to any newly created jobs. If all of the jobs that you create in Estimate will use the same rules, defining the data in the Master Job Properties form will save time when you create new job folders in Estimate.
In addition to the primary Forecast (T/O) Quantity and Unit of Measure on each cost item, Secondary Quantity and Secondary Unit fields in the Cost Item Record can be used to capture a meaningful, alternative quantity and unit on which to analyze As-estimated data.
You can establish the historical data to be used for benchmarking the current job, define the default benchmark graph display, and define high, low and medium variance ranges on the Job Properties - Benchmarking form.
From the Backstage View, select Library from the left pane navigation.
From the Ribbon, select the Setup tab. Under the section Master Initialization, select Job Properties. The Job Properties register opens.
On the Job Properties form, select the Benchmarking tab.
The Historical Data Source defaults to Data Warehouse. Select the historical data to use: As- Estimated, As-Built, or both.
To define Default Cost Item Matching Criteria, click the Edit button and define your criteria for matching cost items. You can select one or many fields and relate them using AND/OR logic.
To define Default Account Code Matching Criteria, click the Edit button and define your criteria for matching cost items. You can select one or many fields and relate them using AND/OR logic.
A matching benchmark data point will be excluded if its unit of measure type (e.g., area, length, etc.) is different than the unit of measure type of the matching item in the current estimate.
To filter the jobs to include, click the Edit button on the Default Jobs Filter and define your job filtering criteria.
Choose your Benchmark Graph Display Options:
Define your average calculation method as either Average or Weighted Avg (weighted by current Qty).
Define the Benchmark values that will be calculated from the historical data set by selecting Cost per Unit, Man-Hours / Unit and Units / Man-Hour.
Define the variance ranges to be used for flagging an item relative to the benchmark data:
To customize the display colors for the Low, Medium and High ranges, click on a color block and choose a different color.
To set a minimum number of benchmark data points required for an item to be benchmarked, select a number in the Don't benchmark items with fewer than historical data points field.
NOTE: The data in the Master Job Properties form is automatically copied to any newly created jobs. If all of the jobs that you create in Estimate will use the same data, descriptive information and rules, defining the data in the Master Job Properties form will save time when you create new job folders in Estimate.
The Job Properties - Benchmarking form is used to establish the historical data to be used for benchmarking the job, and to define the default benchmark graph display and calculations.
The Job Properties - Benchmarking form includes:
The defaults for the benchmarking graph are defined on the Job Properties - Benchmarking form, but on the Cost Item Record - Benchmarking form you have the ability to override the default criteria in order to expand or contract the amount of historical data being used to calculate benchmark values for a specific cost item. This way, you can filter the historical data sources to only the past jobs that are relevant to that cost item.
Before starting this procedure, make sure to set up your default benchmarking options, as outlined in the Benchmarking Options topic.
From the Ribbon, select the Estimate tab. Under Breakdown Structures, select Cost Breakdown Structure (CBS).
On the Cost Breakdown Structure (CBS) Register, select the More Actions tab. Under the Tools section, select Refresh Benchmarks.
The Refresh Benchmarks dialog shows the Last refresh date and the number of Jobs matching filter criteria.
Open the Cost Item Record of any preferred cost item.
Click on the Benchmarking default data block located in the lower right portion of the Cost Item Record.
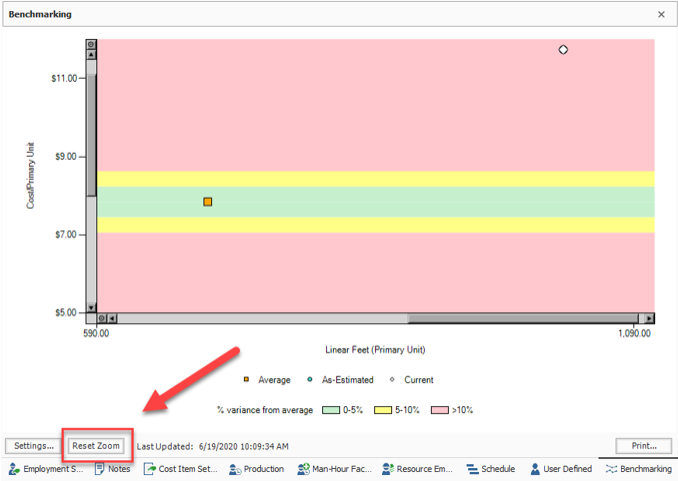
The benchmarking graph shows the historical benchmark values for this cost item, along with the Current value, the Average value, and the variance ranges represented by each color. This information is calculated and displayed as specified on the Job Properties - Benchmarking form.
To refine the values that contribute to this cost item's graph, click the Settings button to display the Settings dialog:
To zoom in on a portion of the graph, click and drag across the portion of the graph that you want to enlarge. To view the entire graph again, click Reset Zoom.

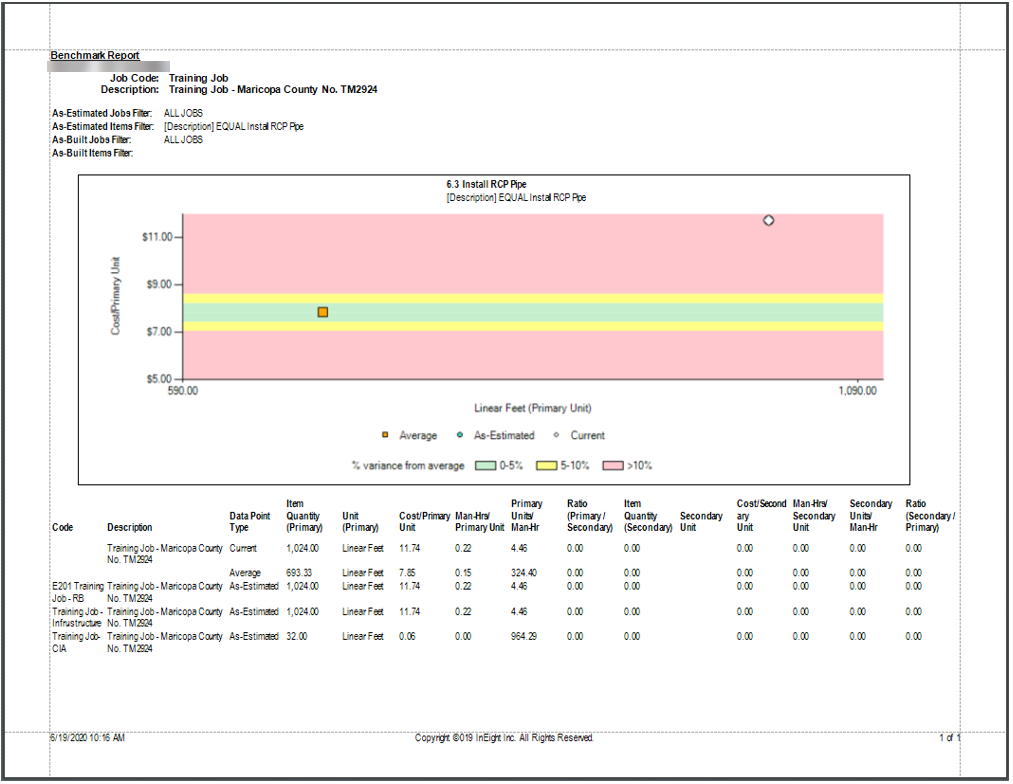
To print a Benchmark Report, click the Print button, change any options as necessary on the Benchmark Report dialog, and click Run.

The Account Code Utilization Register is used to roll estimate line items into an account code hierarchy, with the ability to control which cost items contribute quantity to their parent, in order to benchmark against historical projects in a way that is consistent across projects.
The Account Code Utilization Register is similar to the Cost Breakdown Structure (CBS) and the Master Cost Breakdown Structure (CBS), with the following exceptions:
When an Account Code is assigned to an employed resource, the resource's total Cost/Mhrs are removed from the Account Code associated with the cost item and placed, instead, in the Account Code assigned to the employed resource.
The parent-child hierarchy for Account Codes is based on the Account Code Hierarchy Separator, which is located from the Backstage View Settings under the Options drop down labeled as Account Code Settings. The Hierarchy Separator defines the parent-child relationship within the Account Code structure.
The Account Code Utilization Register is used primarily for analysis, and most of the columns are read-only. Most of these columns originate on the Account Codes tab in the Foundation Setup Data Register and the Master Foundation Setup Data Register. Modifying an editable column on this form has the same effect as modifying the same field on the Account Codes tab of the Foundation Setup Data Register or on the Account Record. For further information, see Creating Account Codes.
The Benchmarking portion of the form is similar to the Benchmarking data block on the Cost Item Record, with the following exceptions:
Additional Information
9977 N 90th Street, Suite 250 Scottsdale, AZ 85258 | 1-800-637-7496
© 2024 InEight, Inc. All Rights Reserved | Privacy Statement | Terms of Service | Cookie Policy | Do not sell/share my information
