Cost Item Details
The Cost Item Record contains other tabs (called Data Blocks) in addition to the Production tab, for storing and calculating information specific to that cost item.
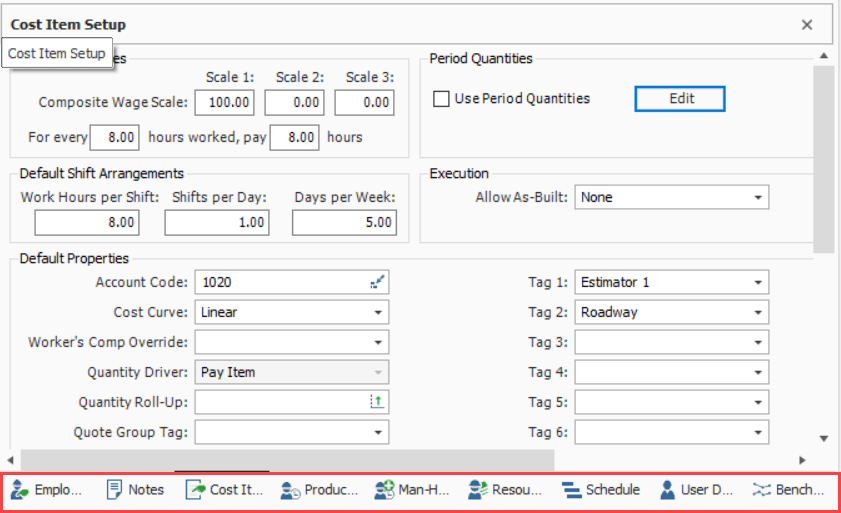
You can add to or adjust the information on these tabs as needed, based on the cost item’s circumstances. In this section, you will review three of the tabs (in addition to the Production tab) you will likely use most often: Cost Item Setup, Notes, and Man-Hour Factors.
Cost Item Setup
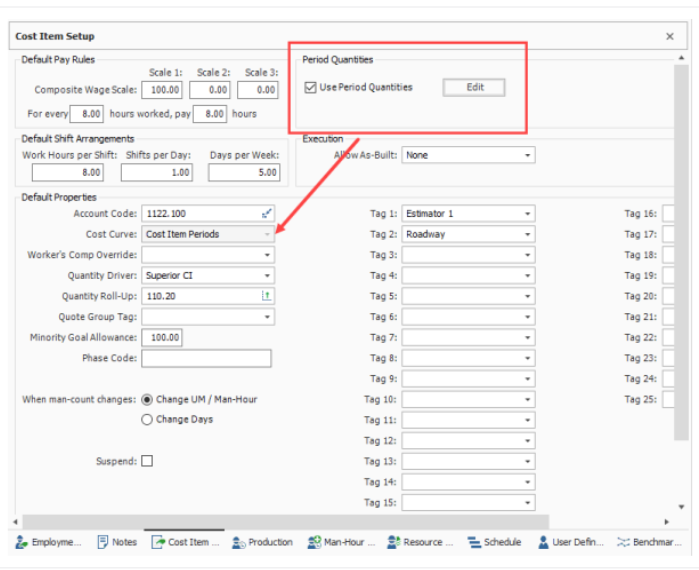
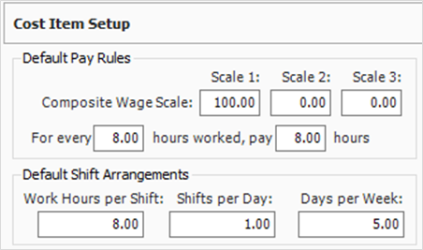
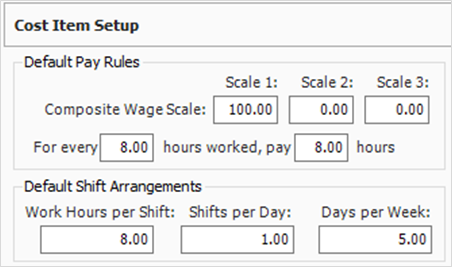
On the data block where the Production tab was found, there is also a Cost Item Setup tab where you can adjust wage scale and shift arrangements for a specific cost item.
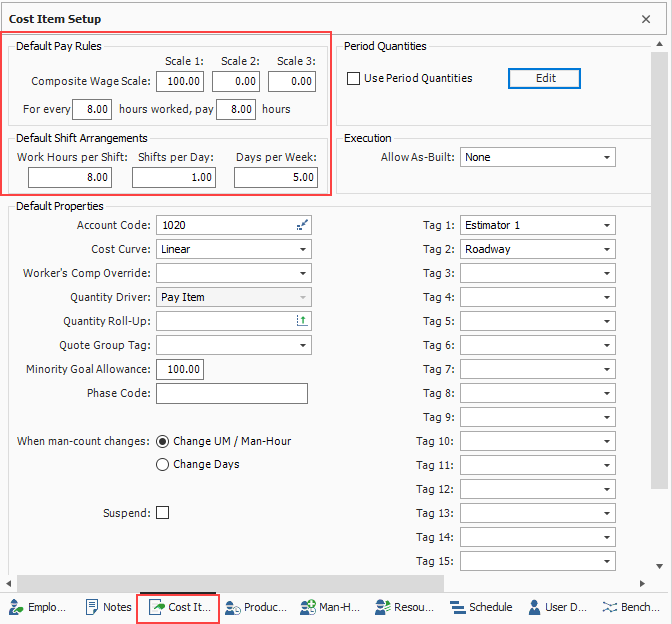
The composite wage scale and work and pay hours are used in the calculation of the cost of employed labor resources. The data reported on the Default Pay Rules tab is, by default, the composite wage scale and work and pay hours defined on the Job Properties - Cost Basis tab for the current job.
These settings can be modified from the default on a cost item-by-cost item basis.
The Pay Rules for cost items can also be defined or modified on the Cost Breakdown Structure (CBS) Register in the Scale 1, Scale 2, Scale 3, Work Hours Rules, and/or Pay Hours Rules columns in the row of the subject cost item.
Cost Curves
Cost curves are used to determine how the cost of a cost item is distributed over time. The main benefit of defining the cost curve for a cost item is to create a more accurate estimation of the cash flow over the life of a project.
The schedule dates entered on a Cost Item are used to define the periods across which a cost item will incur its costs. A cost item’s start and finish dates can be entered manually by the user or established using Schedule Integration, and the time periods (day, week, month, quarter, year) are determined in the Cash Flow settings in Job Properties. For more information on scheduling, see topics Microsoft Project and Primavera.
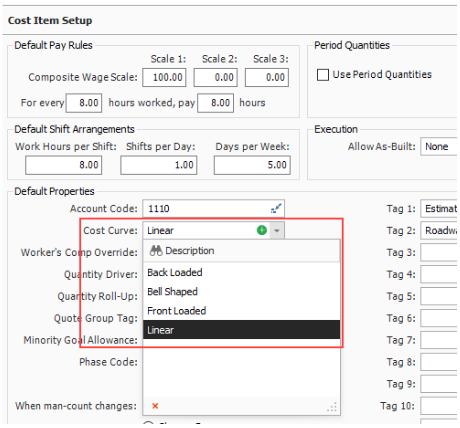
By default, Cost Items have a linear cost curve, which distributes the cost of the cost item equally across all periods for the Cost Item. There are 5 different types of cost curves that can be selected from in the Cost Item Record > Cost Item Setup page.
| Cost curve type |
Definition |
|---|---|
|
Back Loaded |
Costs are low for most of an activity's timeline, but then increase towards the end. This curve type starts out with a lower slope and gradually becomes steeper as the work progresses. Most resources are assumed to be consumed later in the activity and may be more characteristic of subcontracted work where costs are incurred as the work nears completion. |
| Bell Shaped | Expenses are low at the start of an activity, increase during construction, and decrease as the project approaches completion. Bell shaped cost curves incur the majority of their costs towards the mid-point of the work and exponentially increase and decrease from the beginning to the end of the activity. This type of curve can be characteristic of larger portions of work that start with a few resources, ramp up to a peak, incurring more costs during the ramp up, then ramp back down as the work nears completion. |
| Front Loaded | A front-loaded cost curve is when costs are incurred early in a activity. This can happen for several reasons such as early procurement of materials to take advantage of lower prices or to address long lead times. |
|
Linear |
Linear cost curves take the total cost of the activity and spreads it equally amongst the specified periods. |
|
Cost Item Periods |
Invoked by using the Period Quantities feature (described below). Cost Item Periods are used to customize cost curves based on the quantities consumed in various periods. In comparison to the other curves which spread the items total cost proportionally based the chosen cost curve, the Cost Item Periods option can generate a more precise distribution of costs to specific periods because the user can simply define how much quantity of work is getting completed in each specific period.
|
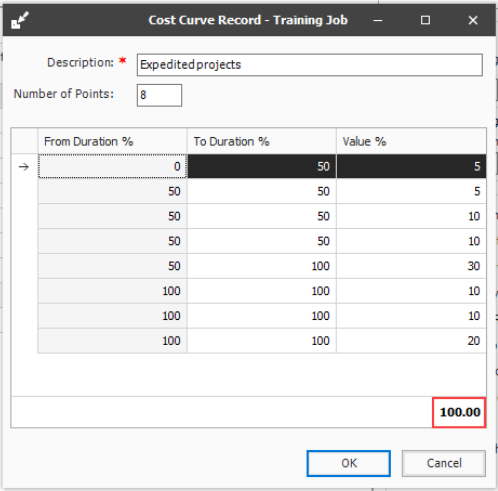
You can also choose to create your own custom cost curve by clicking on the add button in the Cost Curve drop-down menu.
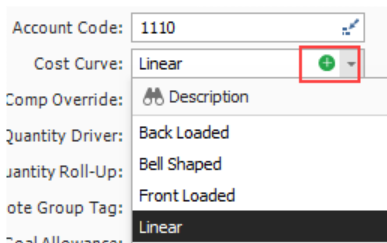
Custom cost curves let you define your own from and to durations along with their associated values, which need to add up to 100%.
Cash Flow
All cost curves, regardless of type, impact the generation of the cash flow graph. The Cash Flow form provides a graphical representation of the cash flow and resource utilization of your project, so you can quickly assess financing and resource needs.
You can open the Cash Flow form by selecting the Estimate tab from the Estimate landing page, then selecting Cash Flow from the Schedule section.
To generate a cash flow curve, the estimate must be populated with schedule dates either directly from integration with Primavera, Microsoft project, or input manually.
Cash flow options
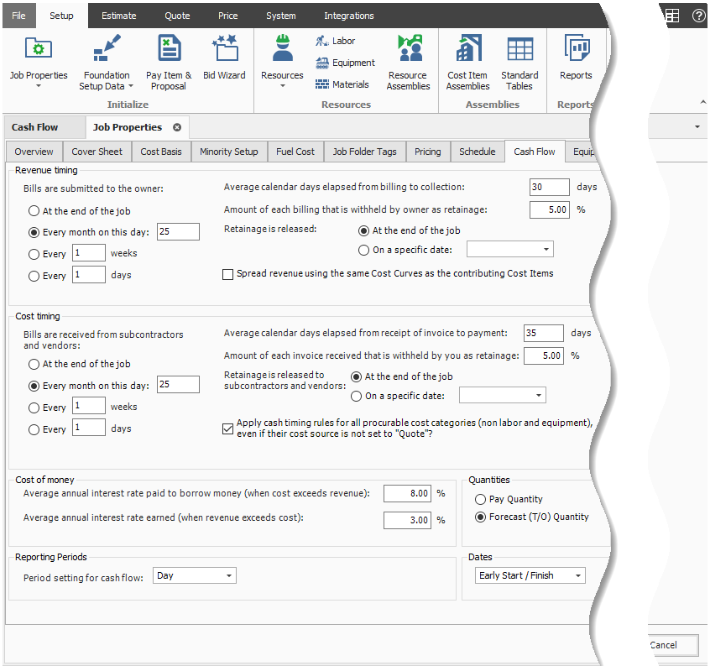
The Cash Flow Options are used to define the cash flow rules (revenue timing, cost timing, cost of money, and quantities) needed to calculate the finance expense and cash flow for your project.
Cash flow rules (revenue timing, cost timing, cost of money, and quantities) describe how cash flow occurs between a contractor and a client, and between contractors or owners and vendors/subcontractors. Cash flow is then calculated based on both the earning and payment terms you specify, and the job's schedule and pay item prices.
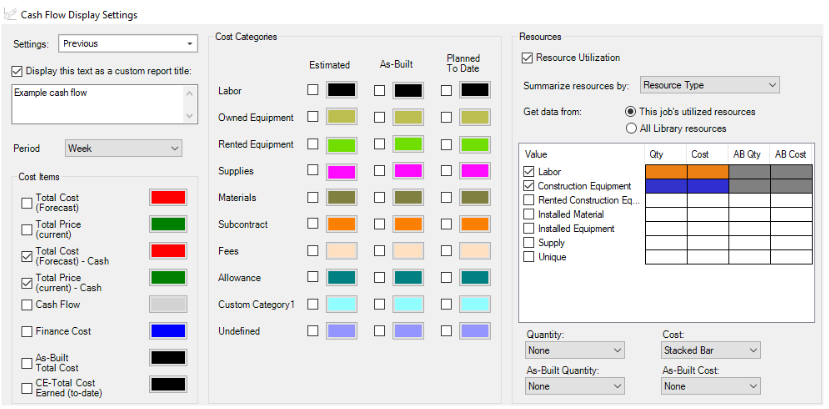
Cash Flow Display Settings
The Cash Flow Display Settings allow you to control what information displays on the Cash Flow graph.
Cash Flow example
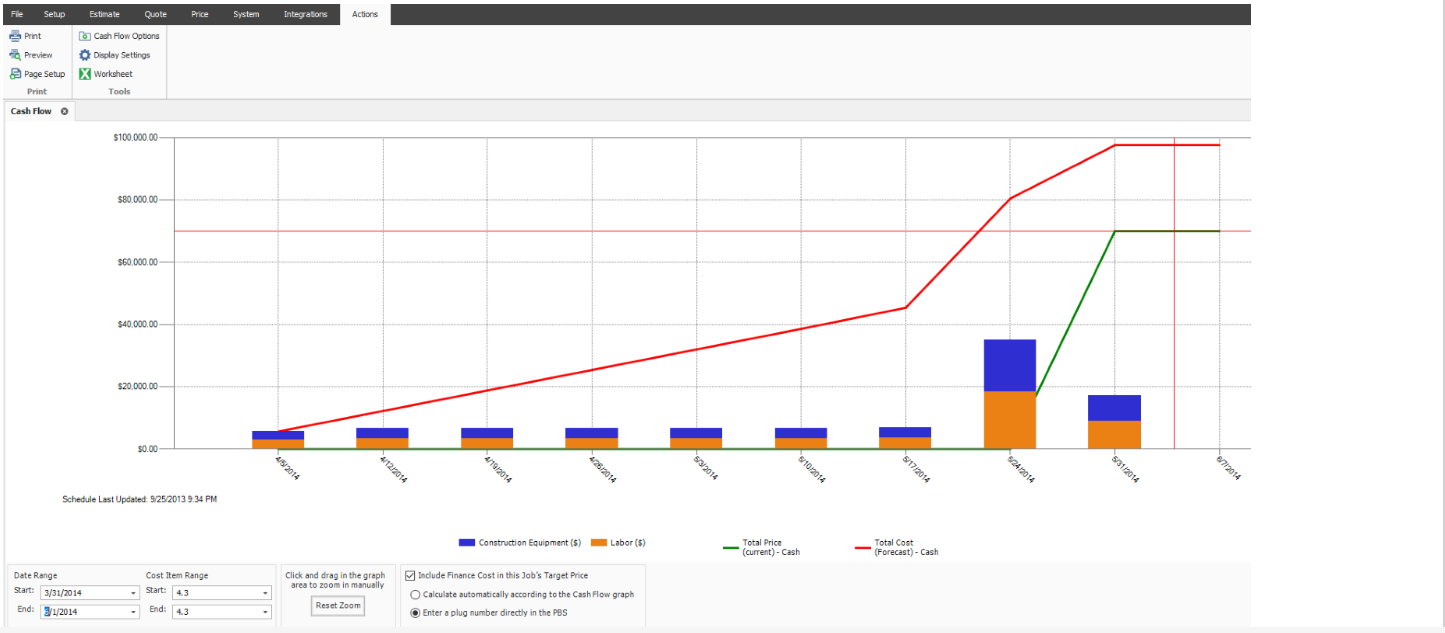
Using the Period Quantities cost curve type as an example, on the Cash Flow graph, you can see that 50% of the total cost for this cost item, represented by the red line, is incurred in the first period of the project. Half of the project’s cost is incurred during the first period of the project’s lifespan as determined by what is entered in the cost item’s period quantities.
A reason why half of the project’s cost is being used during the first period could be that resources available to perform the project happen to be mostly available during the front end of the project.
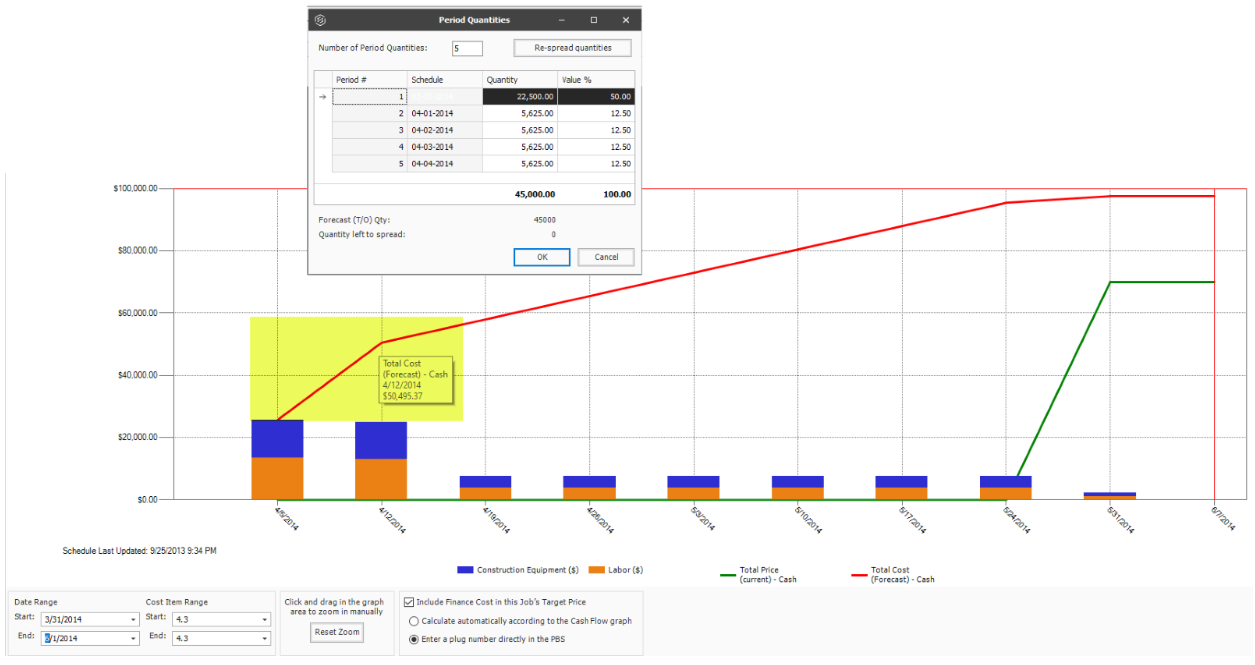
After the first period, the project incurs the remaining balance of the total project cost of $95,000. This is spread equally with quantities of $5,625 amongst the last three periods. This information helps you to better understand when the owner provides payment, in addition to deciding if more project funding or financing is needed.
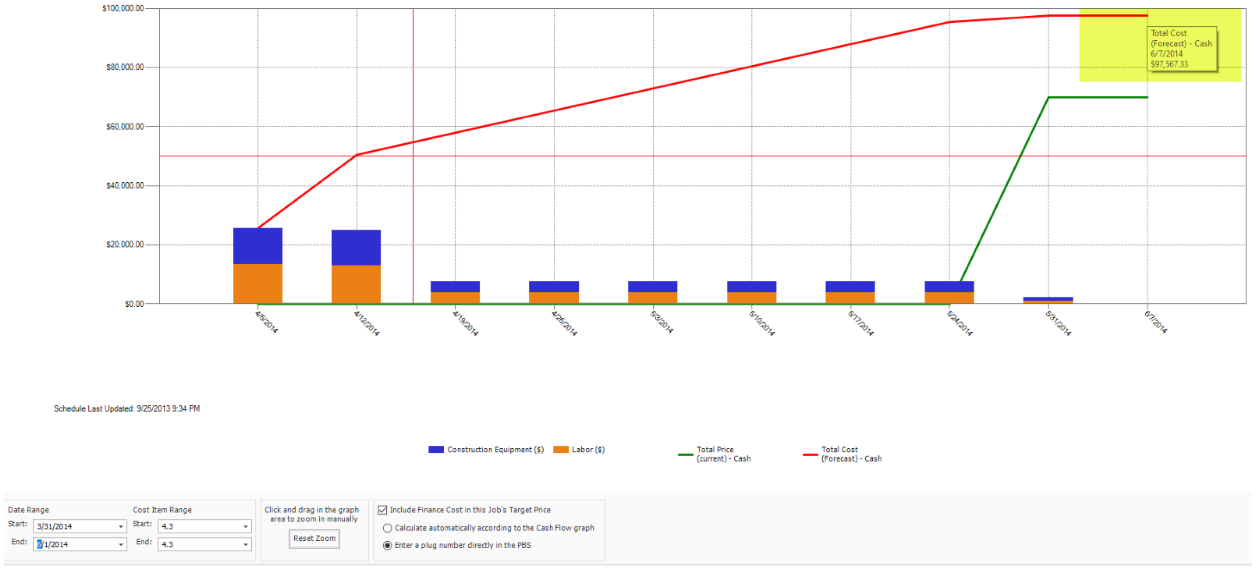
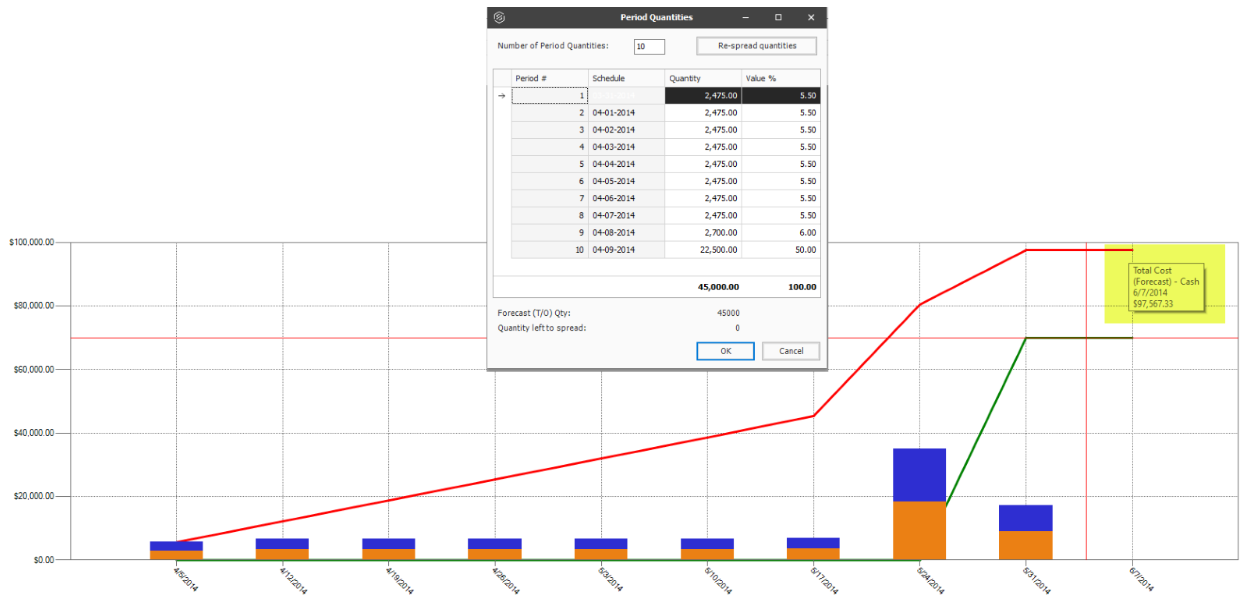
Perhaps most costs on this one item will be incurred at the end of the activity, such as a subcontractor billing for most of his work as it nears completion. If it’s determined costs are incurred towards the end of the activity, you can attribute most of the cost items quantity in the last period. You can add any number of additional periods to a custom cost curve or to a cost curve defined by period quantities curve and the costs will be proportionally spread across the actual number of periods defined by the Cost Items start and finish dates and cash flow settings. Be aware reducing the number of periods in a front or back end loaded curve may show a steeper total cost in some periods.
Using period quantities as the cost curve helps you determine how much of a cost item’s cost is going to be spread in different durations of time.
Period Quantities
Like the other four cost curves, Period Quantities are used to customize cost curves, which show you a graphical representation of the cash flow and resource utilization so you can assess the proper financing and resource project needs. When the Period Quantities check box is selected, the Cost Curve automatically changes to Cost Item Periods.
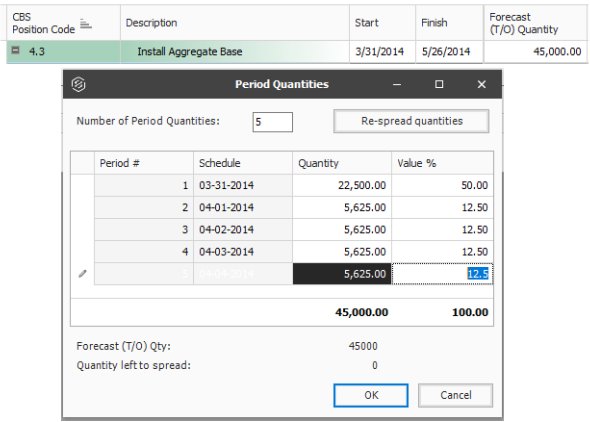
The Period Quantity calculator uses the cost item quantity assigned to various periods to calculate the specific percentages attributable to each range of periods covered by the cost item. The purpose of using period quantities is to spread costs via the cost curve in the cash flow analysis. For example, if you have an item where 50% of the cost is incurred when you start the work because you have to buy all the material first, then you would want a customized cost curve to reflect that this is how the costs will be incurred over time when building that work.
In the example below, since 50% of the cost is incurred when the project starts, period one's quantity is 50% of 45,000 Forecast (T/O) Qty which is 22,500. The remaining costs are then spread equally across the remaining three periods.
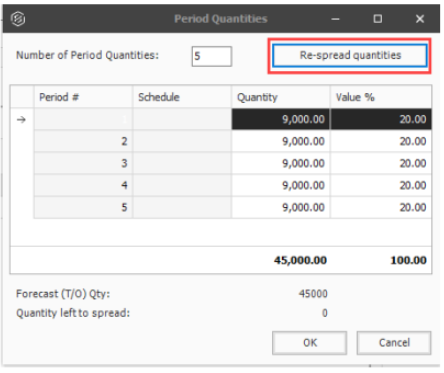
You can also choose to select the Re-spread quantities button to spread the quantities equally among the periods entered in the Number of Period Quantities field.
Step by Step — Adjust shift arrangements
-
From the Estimate tab, select Cost Breakdown Structure (CBS).
-
Right-click on the row header for a cost item and select Open.
-
Select the Cost Item Setup tab in the lower-right portion of the form (the tab name may be abbreviated).
-
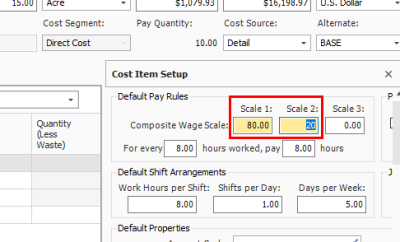
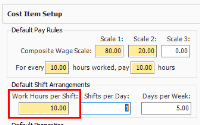
In the Default Pay Rules data block, adjust your Composite Wage Scale as needed.
-
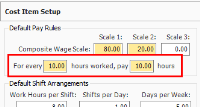
Under the Composite Wage Scale, adjust the number of hours and paid as needed
-
In the Default Shift Arrangements data block, make changes as needed.
-
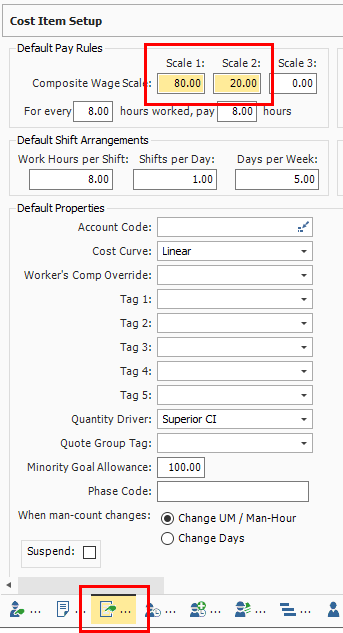
For this example, we’ll make the following changes on the Clearing cost item:
-
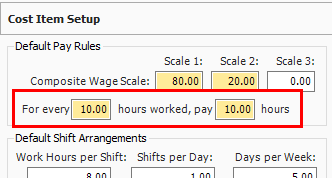
Composite Wage Scale – 80% Scale 1, 20% Scale 2.
-
For every 10 hours worked, pay 10 hours.
-
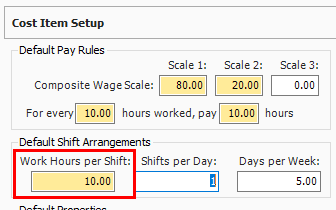
Default Shift Arrangements – Change Work Hours per Shift to 10.
-
-

Notes
On the Cost Item Record, you can enter any cost item-specific instructions, parameters, or general information on the Notes tab. Below are a few examples of the kinds of notes you might enter:
-
For a Hauling cost item: There should be very little waste. If so, we can spread it out in the right of way at MP 111
-
For a Structural Excavation and Backfill item: The backfill cannot be the native material. Have to use clean base rock
-
For an Underground Pipe cost item: The average depth is close to 10 ft.
You can use the Notes tab to reference cost item changes (e.g., changing shift arrangements, changing a resource rate).
Man-Hour Factors
For items that have known risks or potential resource concerns, you can apply a Man-Hour Factor to take those risks into consideration.
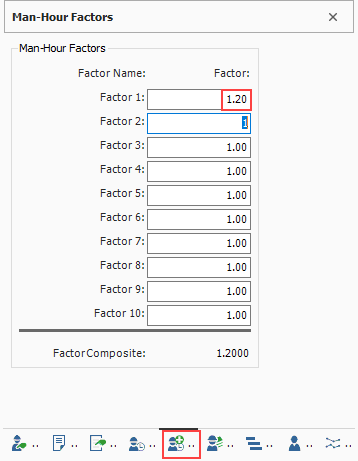
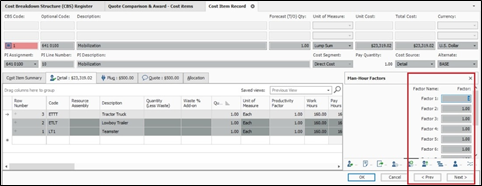
Man-Hour factors are applied on the Man-Hour Factors tab on the Cost Item Record. Factors are applied in relation to 1, where slower production is greater than 1 and faster production is less than 1.
Man-Hour Factors affect both Labor and Equipment Hours.
For example, if you predict production to be 20% slower due to weather concerns, you would type 1.2 in the weather factor field.
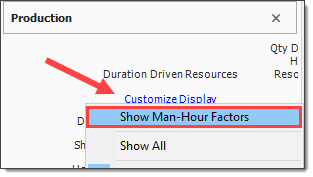
Even after defining a Man-Hour Factor, the Production tab will still display the original Production values.
-
To see the factored Production values, click the Customize Display link on the Production tab and select Show Man-Hour Factors
-
Both original and factored production are then displayed on the Production tab
You can apply Man-Hour Factors to multiple cost items at once by Multi-Editing selected cost items on the CBS Register.
Unique Identifier
You may have noticed when you made changes on the Cost Item Setup tab, that the fields you changed and the Cost Item Setup tab became highlighted, indicating they were altered from their original state.
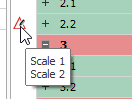
On the CBS Register, the cost item you edited now has a Unique Identifier in the row header indicating the cost item was altered from the default values set in the project job properties or in the project library of resources rates.
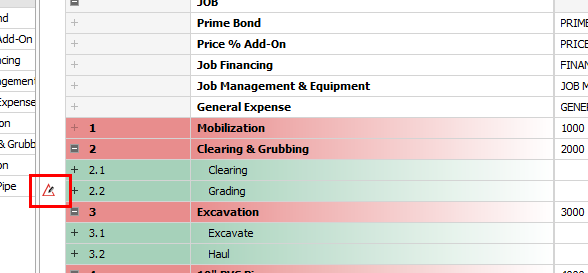
If you hover over the identifier, a pop-up menu appears indicating what data points were changed.
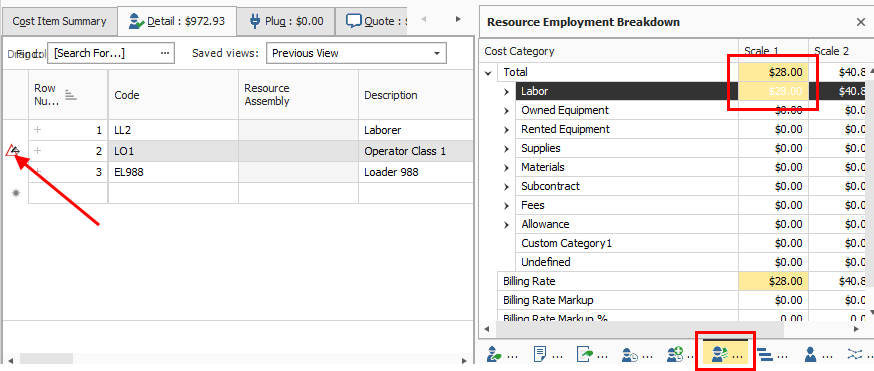
This same identifier will show up for resources as well, if you make changes to the employed resource’s cost to be different than the original resource rate imported from the Resource Rate Register.
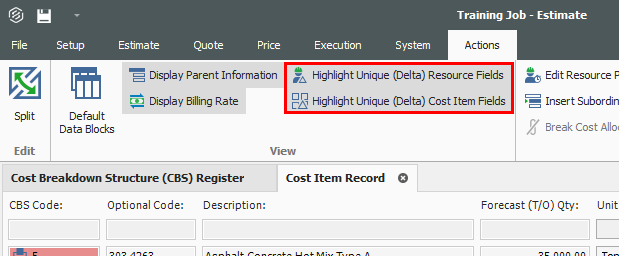
Highlight Unique (Delta) Toggle
You can turn the highlighting of unique resource and cost item fields off and on from the Actions menu of the Cost Item Record, under the View section.
Cost Drivers
Each type of resource has a default cost driver. For example, Labor resources are duration driven so the cost driver is CI Duration, meaning their costs are driven by the duration of the cost item. If you want an Operator to only be assigned to a specific cost item or work activity for half the time, you can change its quantity to .5 and it will be driven by half of the cost item’s hours.
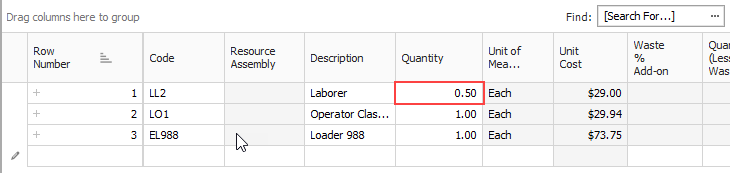
To enter work hours manually for the employed resource, you can change the Cost Driver option to CI Quantity or Fixed.
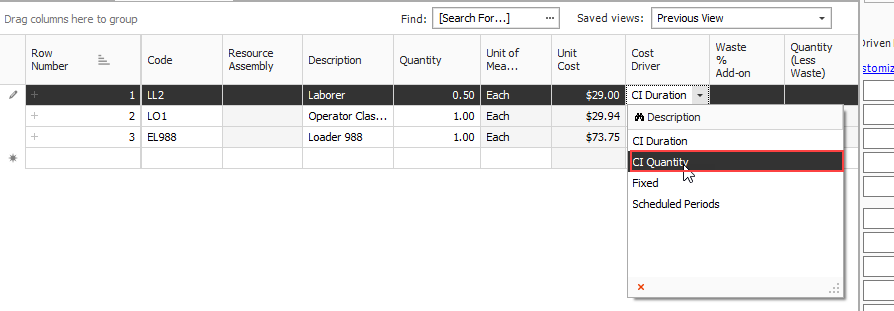
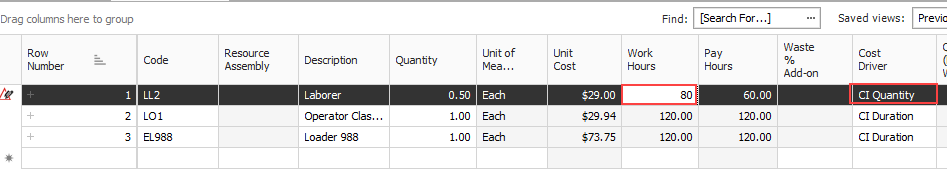
With CI Quantity as your cost driver for the Operator, you can adjust the Work Hours manually, where previously that column was read-only.
Let’s say you want your Operator to work specifically 80 hours.
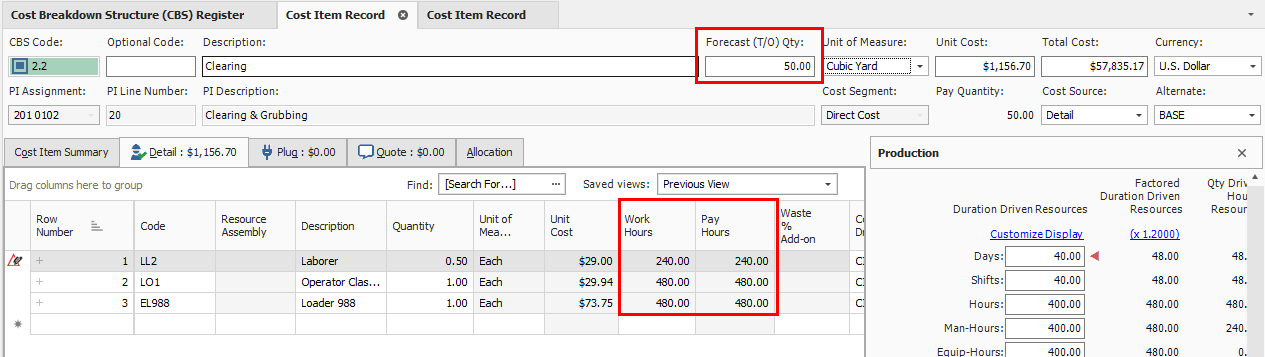
However, since the resource is now quantity driven, if you change the Forecast (T/O) Quantity to 50 you will see that the work hours will still adjust from 12 to 40.
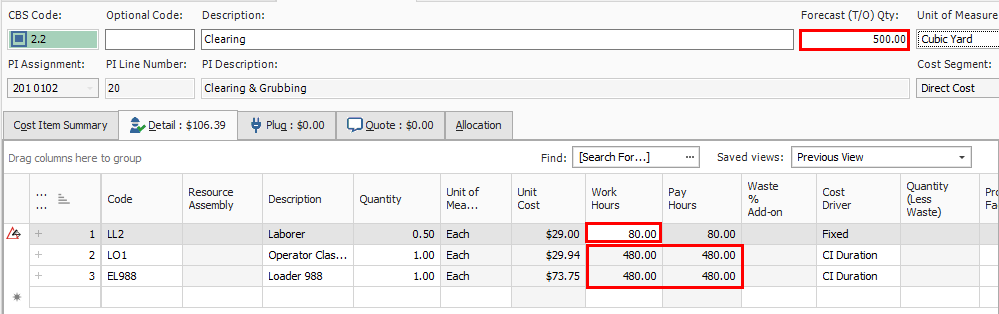
If you want it set at 80 hours no matter what changes you make to your quantity, you can change the cost driver to Fixed. Then when you change the Forecast Quantity to 500, the work hours for the Operator will not change and will remain at 80 hours as shown below.
If you followed along and made any adjustments to cost item 2.1 Clearing, change the Cost Driver for the Operator resource back to CI Duration and the Work Hours back to 100.
Suspend Cost Items
The Suspend feature allows you to turn cost items on and off in order to perform “what-if?” analysis or evaluate alternative approaches to the work.
A cost item can be suspended in InEight Estimate for various reasons including the following:
-
Manually suspended cost items
-
Suspended parent
-
Parent with cost source that is not Detail (plugged or quoted)
-
Parent cost item with a zero quantity
-
Pay item is suspended
-
Allocated cost items
-
Alternate scenarios:
-
Overridden by another alternate
-
Alternative is not active
-
Suspended cost items do not contribute any cost to the job's total value. Suspended items can be un-suspended at anytime in order to be included in the total project value.
Step by Step — Suspend a Cost Item
-
On the Cost Breakdown Structure (CBS) Register, select a cost item.
-
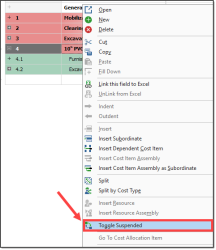
Right click on the selection and select Toggle Suspended from the menu.
-
You can also select Toggle Suspended under the Edit section of the Actions tab up above
-
You can also suspend cost items by checking the Suspend checkbox on the Cost Item Setup tab of a cost item record
-
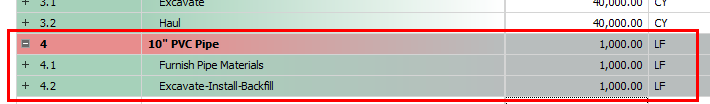
If a superior cost item is suspended, its subordinate cost items are automatically suspended as well
-
The costs associated with these cost items will no longer contribute to the estimate
-
Editable Man-Hour Factors in Suspended Cost Items
You can edit Man-Hour Factors for a suspended cost item by creating and maintaining cost items, including Man-Hour Factors. This can be accomplished in a suspended state while having the scope of work included in your estimate. The cost to contribute is excluded from the scope of work until you are ready to make it part of your estimate.
Unsuspend a Cost Item
Follow the step by step below to unsuspend a cost item.
Step by Step — Unsuspend a Cost Item
-
On the Cost Breakdown Structure (CBS) Register, select a cost item.
-
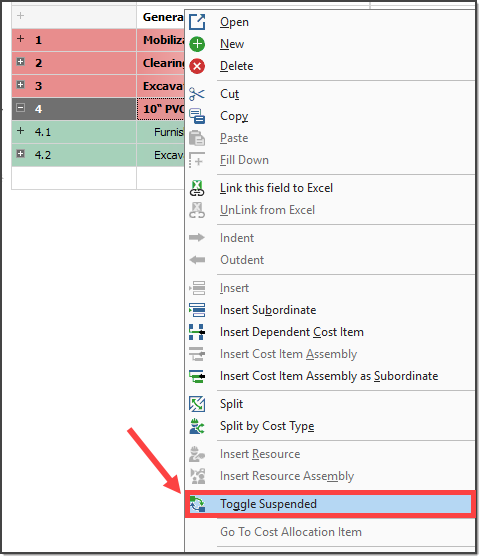
Right click on the selection and choose Toggle Suspended.
-
You can also select Toggle Suspended from the Edit section of the Actions tab
-
You can also unsuspend cost items by unchecking the Suspend checkbox on the Cost Item Setup tab of a cost item record
-
Suspend Column
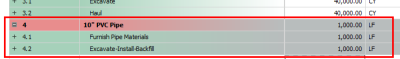
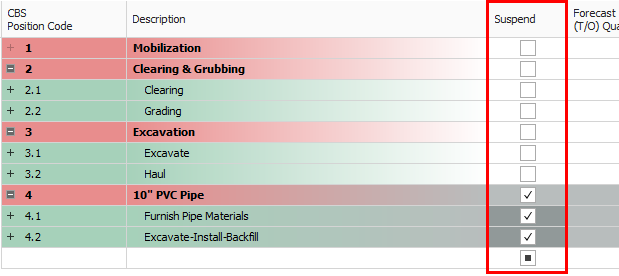
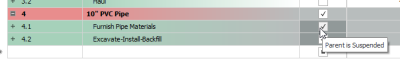
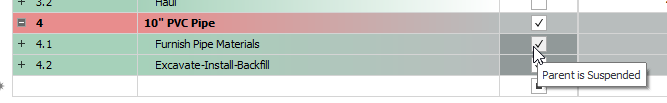
Within the CBS Register, the Suspend column indicates which cost items are suspended.
-
Hover over the checkmarks to see why the cost item is suspended
-
You can suspend and unsuspend cost items by checking and unchecking the checkboxes in the Suspend column as well
Adding Cost Adjustments
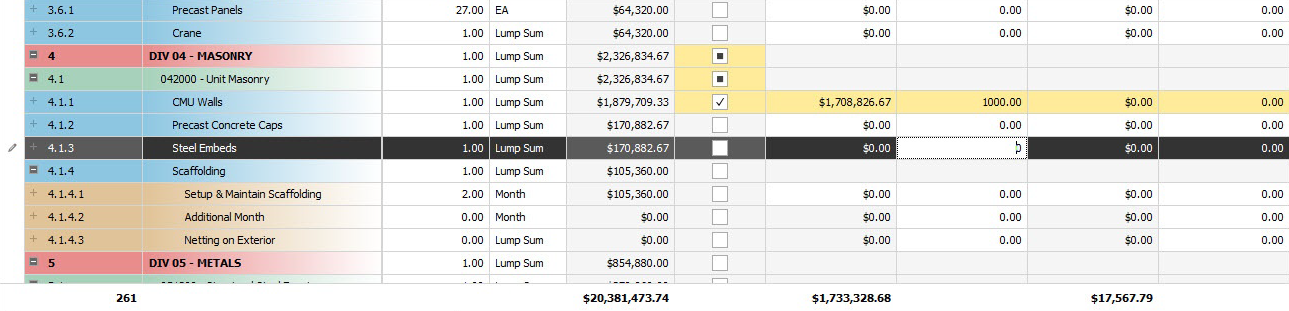
Total Cost and Billing Adjustments can now be made in the CBS register which can be viewed either from the Standard view of the CBS register, or a saved view affiliated with change.
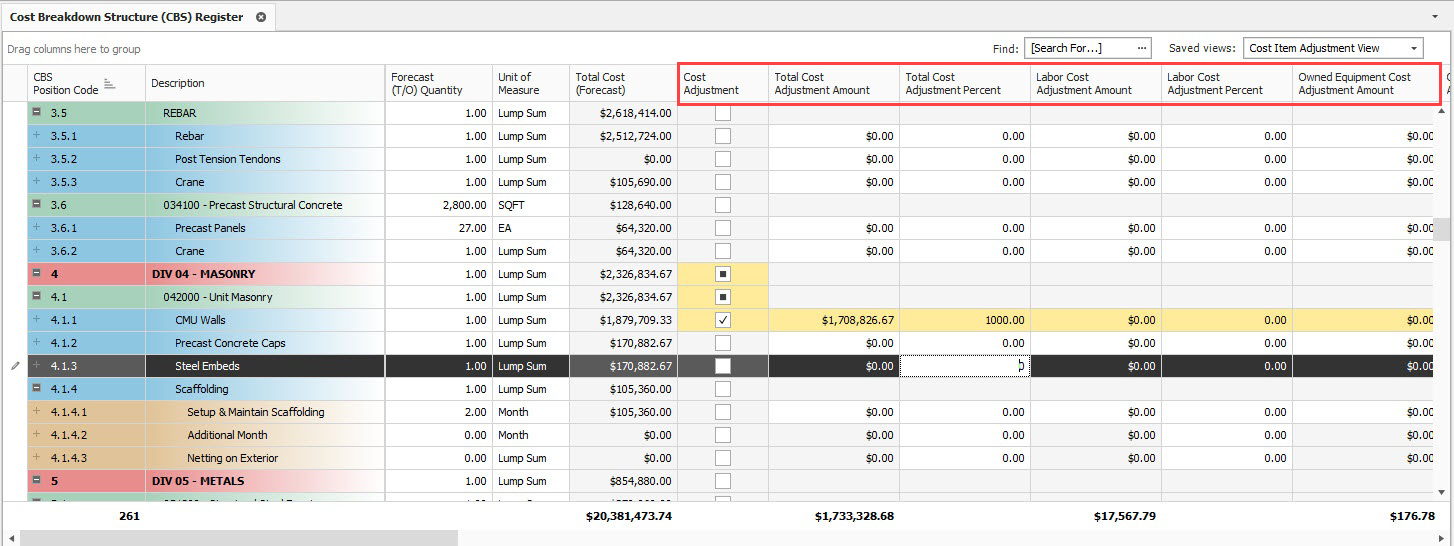
Adjustment fields have been added to the CBS to view and modify the adjustment amount and adjustment percent without going into each individual cost item.
Any adjustment made to the Adjustment Amount fields on the CBS register will then have the Adjustment Percent field automatically calculated. Changes made to those fields will be highlighted in yellow signifying an adjustment has been made.
Other adjustments fields in the CBS register include the many adjustments fields that have been added to the Billing Rates View.
A new Saved view called Cost Item Adjustment View has been added to the Cost Breakdown Structure.