Products
Solutions
Resources
9977 N 90th Street, Suite 250 Scottsdale, AZ 85258 | 1-800-637-7496
© 2024 InEight, Inc. All Rights Reserved | Privacy Statement | Terms of Service | Cookie Policy | Do not sell/share my information


At the project manager’s request, the project controls manager puts procedures in place to gather the time and cost-related information in one place for Earned Value Management reporting. As a result, she is able to provide reports during the weekly progress meeting that include earned value curves comparing planned, earned and actual values.
With the proper setup, you can run earned value curve reports to measure and analyze project progress.
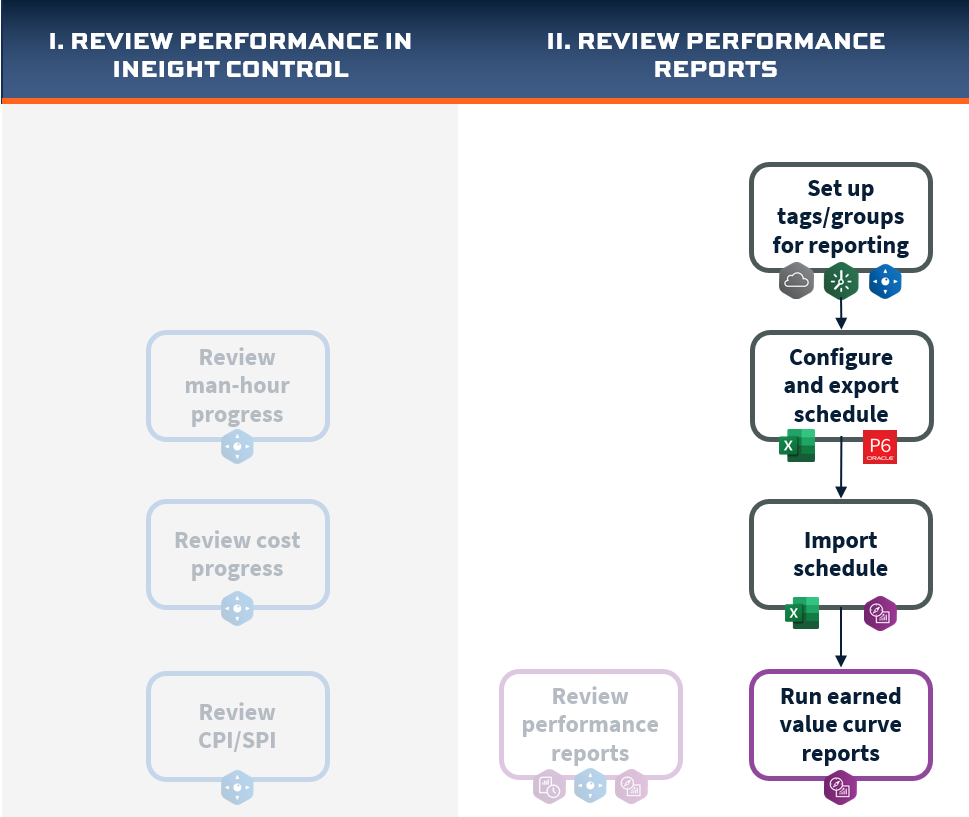
InEight Report contains several S-Curve reports for earned value:
Manhour Curves
Commodity Curves
Earned Values
Earned Values by Percent Complete
These reports show your planned, earned, and actual values on a graph over time.
Your earned and actual values come from InEight Control.
The planned values (with their respective dates) must be imported from your schedule.
The workflow below provides more detail on the process for importing your planned schedule values into InEight Report:
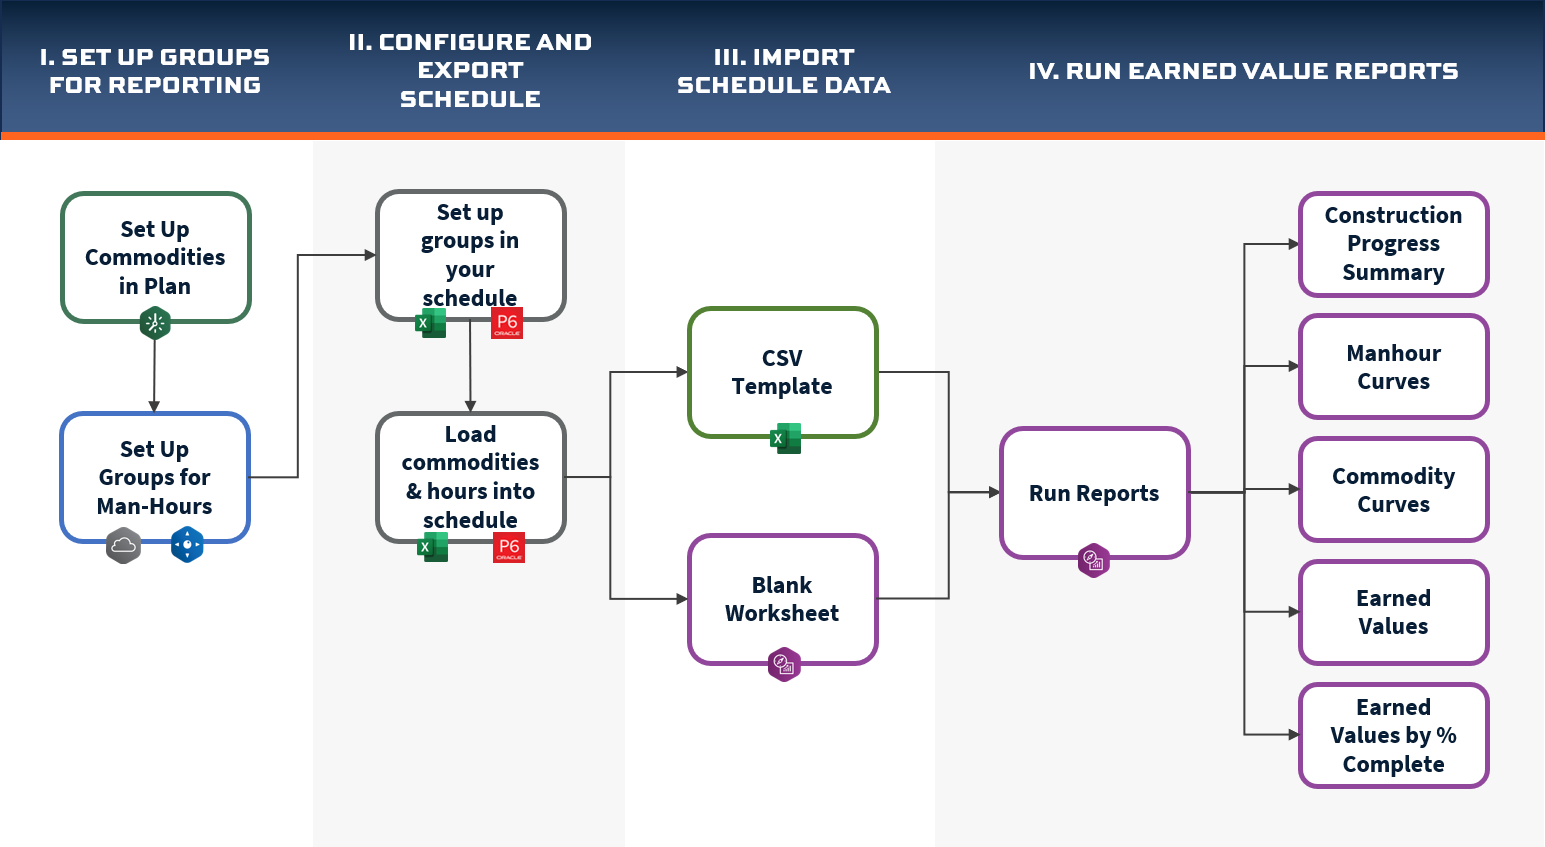
Before exporting your schedule data, you’ll need to organize your data into groups so you can report on subsets of your data. You can do this by assigning labels or tags to your activities prior to exporting.
The following table lists the tags/fields used in the InEight software for earned value reports.
| TAGS / FIELDS FOR EARNED VALUE |
|
Account Code Commodities Man-Hours Plan Construction Commodity CBS tags 1-25 CBS user defined field 3 |
Whichever tag you use for grouping your data in InEight, you will need to make the same assignments to the corresponding data in your schedule.
For reporting on commodities, you need to define your commodities into groups and assign them to your components. Once your components have commodities assigned, you’ll be able to report by those commodity groupings.
From Project Settings, select Project Values.
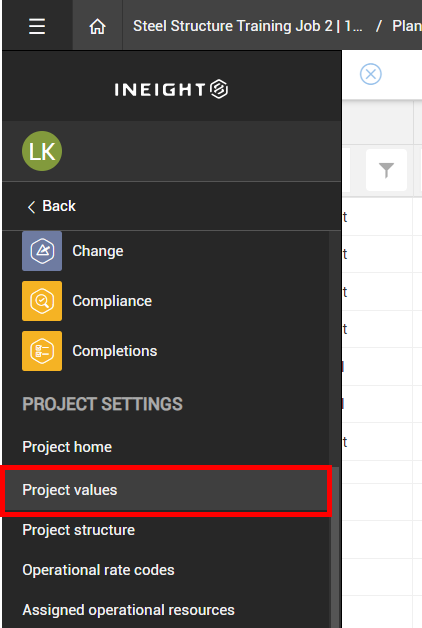
Click on the Construction Commodity tab.

Add your construction commodities with codes and names.

From Plan Quantity Tracking, assign a commodity to each component (selecting Location > Commodity) on the component record.

Set up the same labels and values for your activities in your schedule (e.g., Primavera P6).
You can use cost item tags or user-defined fields to group your data. For example, you may use CBS tag 3 to specify the discipline for each of your cost items. This would allow you to group by discipline on your earned value reports.
For organizing by discipline, you can use any CBS tag, or CBS user defined field 3.
Go to Project Settings > General > Custom Lists.
Click on the Field values link for the tag you want to use.

Add your field values, then click Save.
If you want to change the displayed name of a CBS tag or a CBS user defined field:
Go to Suite Administration > Custom Labels.
Make sure Enable Custom Labels is toggled on.
Click on the one you want to change and type your name in the appropriate language column.

Your organization may use account codes for reporting purposes. An administrator with the right permissions, would stage and publish a set of account codes to assign to your cost items for grouping purposes. Account codes are configured under Master data libraries > Account codes.
You will need to organize your schedule-related data by the same groups you’re using in the InEight Suite.
If your company uses Primavera P6 for scheduling, you can map whatever groups you use in the InEight Suite (e.g., commodity groups, tags, account codes) to a corresponding tag or label in your schedule.
Before you export data, your schedule must be “loaded” with commodities (quantities) and hours, so those planned values can be exported to use for earned value reports.
Below are a couple of options you may use to load quantities and hours into your schedule:
You may want to take advantage of the component data already in InEight Plan to make it quicker and easier to load man-hours and commodities into your schedule (e.g., Primavera P6 or other scheduling application).
Set up columns.
From InEight Plan > Quantity Tracking, use the Column chooser to set up what columns to export, including:
Component name
Component quantity
Unit of measure
Commodity
Activity ID
Activity name

Select Export > Data export.

Format the Excel export file as needed.

Import into Schedule.

The scheduler at your company may already work with your estimators to get your man-hours and commodities loaded into your schedule, as this is usually an owners’ requirement to have a man-hours loaded schedule.
Once your data is loaded with hours and/or commodities, and assigned groups, you can export the data to a file for importing into InEight Report.
If using Primavera P6, you can recreate the InEight Report .csv import template so that your data exports already in the proper format for import.
For other scheduling tools, you can export to an Excel file and then copy it into the .csv import template.
InEight Report also has a blank worksheet option built into the application you can add your information into manually.
Both the .csv template and the blank worksheet are accessed from the Report > Schedules tab, by clicking the Import icon.

When you import or select the worksheet, you will be prompted to fill out some key information for building your earned value reports. This includes selecting the data group to use:

Both the .csv template and blank worksheet have a specific format that must be followed as shown below:

|
Activity ID |
Units |
Dates |
|
Based on the data group you selected (e.g., account code), these will be the values assigned to your schedule activities. |
The import must follow this format of Cum Remaining Early, Cum Remaining Late and Cum Actual. |
Dates must be daily. The values you enter will either be the cumulative man-hours for the activity ID or the cumulative quantities (if using the Plan Construction Commodity label). |
Access the following link to learn more about how to import your schedule data:
With your schedule planned values imported, you can now run reports to compare them to your earned and actual values.
Follow these steps to run a report:
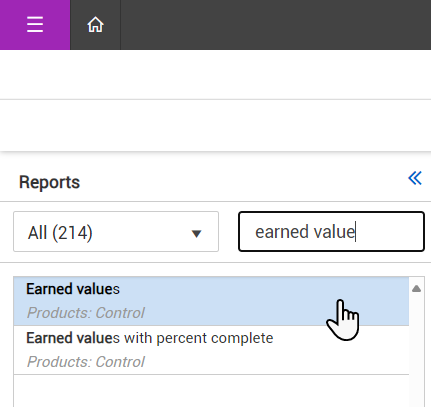
In InEight Suite, select Report.
Use Search to find the report you want to run.

Select the report to view the report properties.
Select report properties.
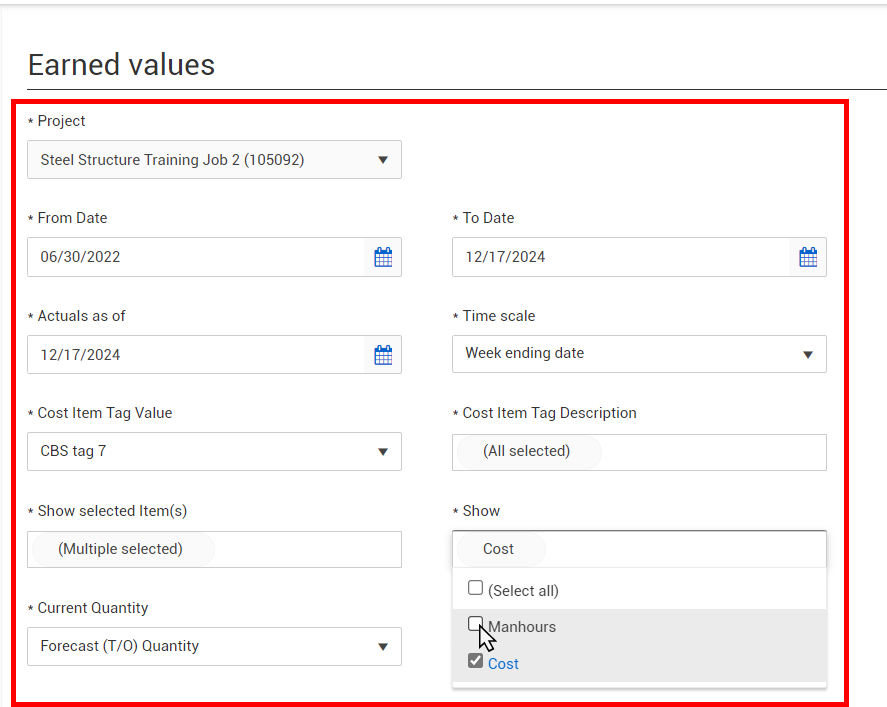
Select Run report.
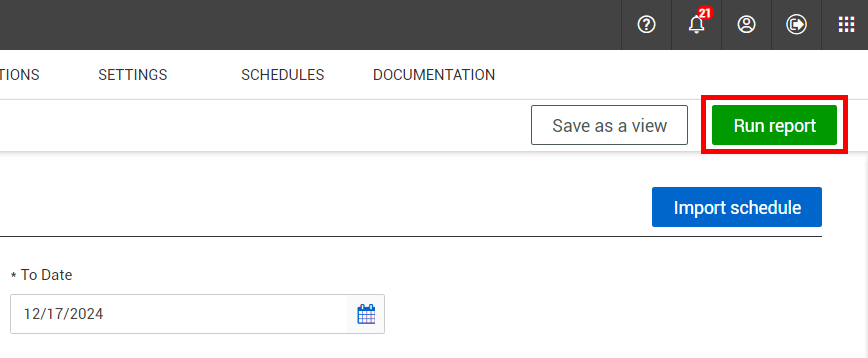
The report will include data based on the parameters you selected in the report properties.
It will include the planned values imported from the Schedule Import file.
Earned and actual values on the report come from InEight Control.

If the report you are running is one you plan to use regularly, you may want to click Save the view. Once you save the format of the view, it can be viewed and/or updated on the My Views tab.

If your company is looking for reports other than those shown within InEight Report, contact your Project Delivery team for further information on using APIs for building your own reports/dashboards in PowerBI.
Additional Information
9977 N 90th Street, Suite 250 Scottsdale, AZ 85258 | 1-800-637-7496
© 2024 InEight, Inc. All Rights Reserved | Privacy Statement | Terms of Service | Cookie Policy | Do not sell/share my information