Products
Solutions
Resources
9977 N 90th Street, Suite 250 Scottsdale, AZ 85258 | 1-800-637-7496
© 2024 InEight, Inc. All Rights Reserved | Privacy Statement | Terms of Service | Cookie Policy | Do not sell/share my information


As part of the project setup, the project controls manager establishes a schedule of reports that run daily, weekly, and monthly to monitor project performance.
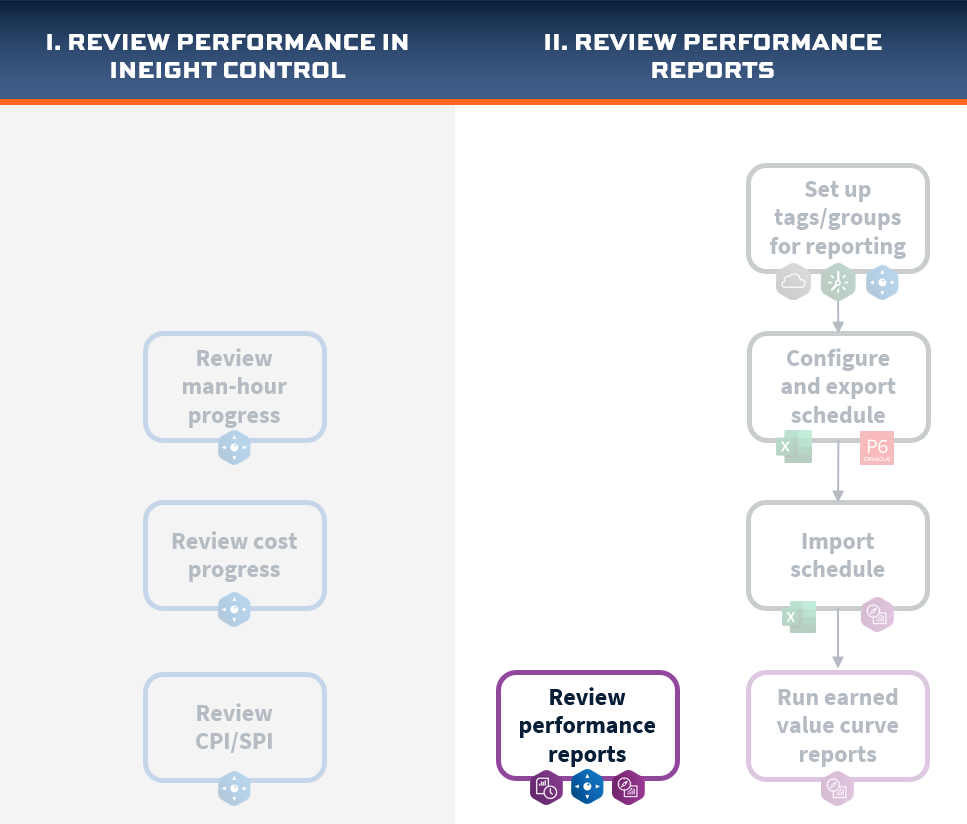
There are a variety of reports and dashboards available to help your team review performance.
Performance reporting allows stakeholders to monitor key performance indicators (KPIs), which measure the overall health of the project in terms of finance, productivity, and risk. Performance reporting requires data to be captured at a point in time that gives you accurate and relevant information for making decisions.
After you select a report, you can then change parameters to refine the report to meet your specific needs. Reports can be saved to PDF, Excel, CSV file format, or can be printed.
A best practice is to set up subscriptions to automate email delivery of reports. Typically a member of the project team would be assigned to set up the subscriptions.
Access the following link to learn more about setting up report subcriptions:

Following are some examples of reports pertinent to earned value management:
Cost Report by Cost Categories
Project Cost Summary
Project Productivity
Revenue Recognition
Crew communicator
Access the following link to learn more:
Ideas on Site
Your project team will likely want to keep a schedule to manage the time and frequency (daily, weekly, monthly) to run each report. See the schedule below as an example.

Access dashboards to see an up-to-date visual summary of key performance metrics. You can open your project dashboards directly from the CBS register in Control or through InEight Explore.
The Cost Item Dashboard slide-out panel shows multiple cost item affiliated graphs. These graphs let you further analyze cost item past and current performance trends related to time-phased distribution, current budget changes, value over time, completion progress indicators, and a CBS audit history log.
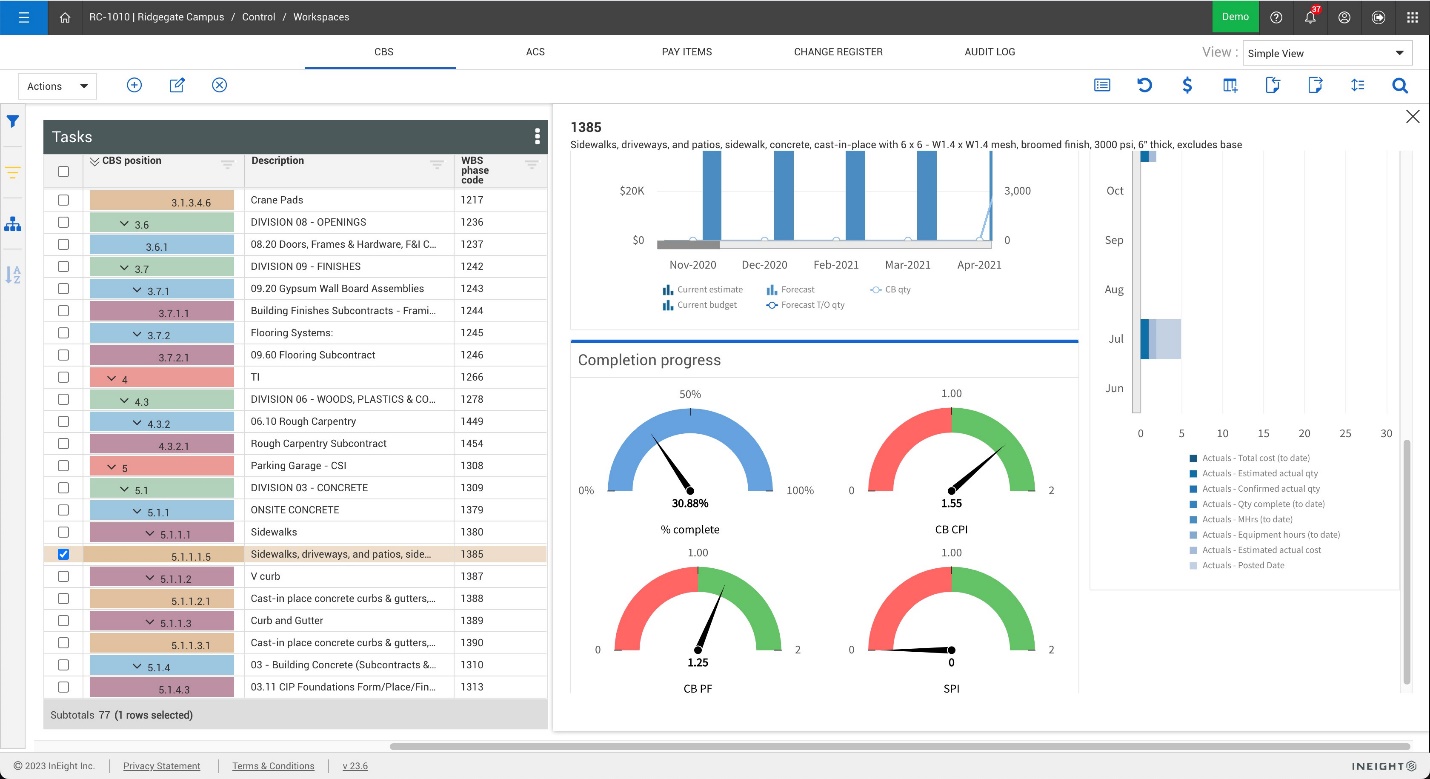
To open the Cost Item Dashboard, right click on a cost item. Then select Cost item dashboard.

Use InEight Explore to access out-of-the-box or custom dashboards.
Open the Control Dashboard to access a variety of metrics. The following tabs are available within the Control Dashboard:
Control Overview (Cost Overview)
Revenue Overview
Cost Curves
MH Curves
Snapshot View
Forecast
Cost Categories
Project Cost Summary


Additional Information
9977 N 90th Street, Suite 250 Scottsdale, AZ 85258 | 1-800-637-7496
© 2024 InEight, Inc. All Rights Reserved | Privacy Statement | Terms of Service | Cookie Policy | Do not sell/share my information