Products
Solutions
Resources
9977 N 90th Street, Suite 250 Scottsdale, AZ 85258 | 1-800-637-7496
© 2024 InEight, Inc. All Rights Reserved | Privacy Statement | Terms of Service | Cookie Policy | Do not sell/share my information

The CBS (Cost Breakdown Structure) is the main tab of the Workspaces page in Control and is the tab where you typically spend most of your time. Each row in the CBS represents a work activity and is called a cost item.
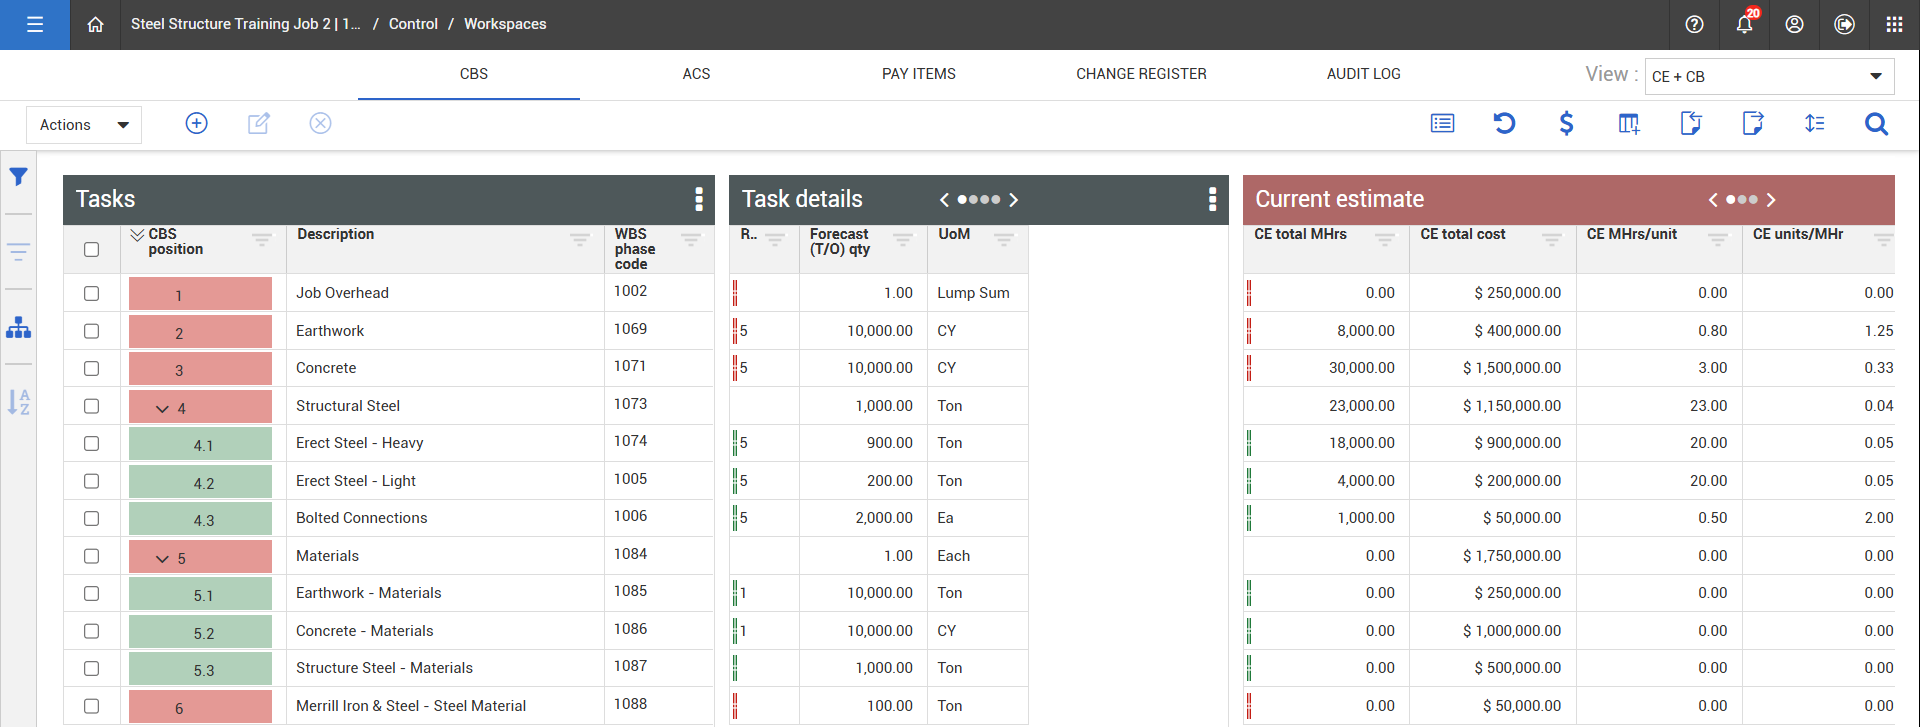
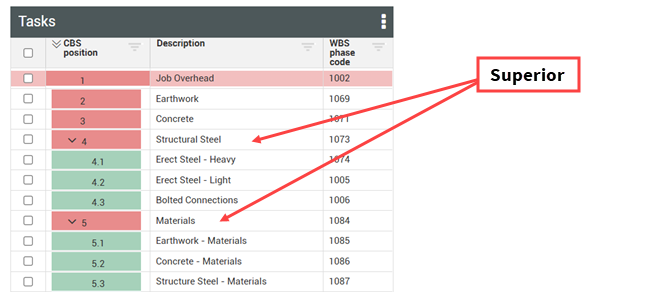
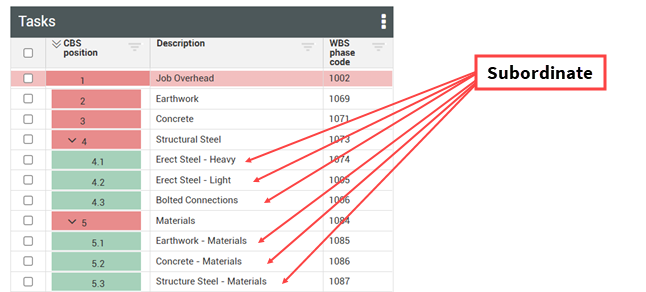
The CBS is organized in a hierarchy of superior and subordinate cost items. A cost item is superior and/or subordinate based on its relationship to other cost items. This is similar to a parent and a child relationship where an individual can be both a parent and a child at the same time. The CBS is color coded to identify which level of the hierarchy a specific cost item is located.
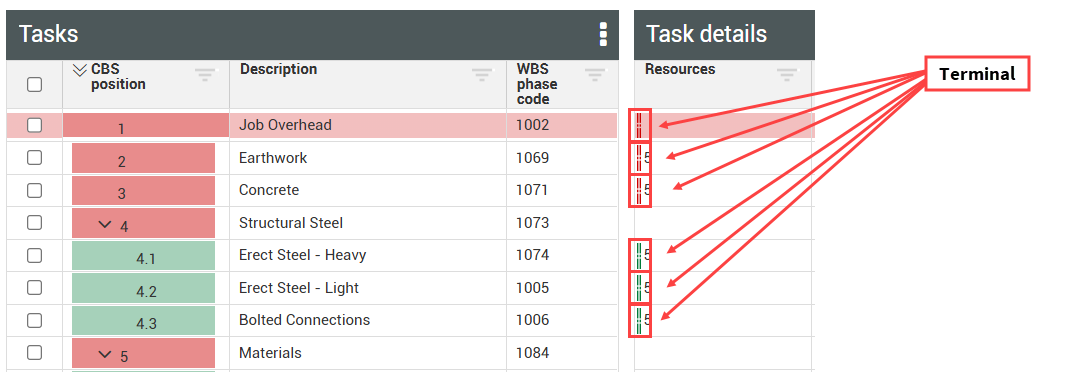
If a cost item has no subordinates it is considered a terminal cost item. Terminal cost items are where cost is tracked. All superior items are a roll up of the budget, manhours, and cost of the cost items below. Terminal items are identified with a special symbol located at the first column of each data block.
This terminology and associated graphics provide a way to communicate and understand the hierarchy of the Cost Breakdown Structure. The following table provides definitions for each of these terms.
|
Term |
Definition |
|---|---|
|
Superior |
Cost item that has subordinate subcost items that roll up under it. |
|
Subordinate |
Cost item that is a child to a superior cost item. |
|
Terminal |
Cost item that has no subordinate beneath it. Costs and hours are defined at the terminal level. |
As accurate as estimators try to build the estimate, changes occur during the project’s execution that affect the CBS register in Control. To learn how to maintain, improve, and use the CBS register properly, this topic focuses on the fundamentals of the Cost Breakdown Structure.
The CBS tree provides a way to navigate up and down your Cost Breakdown Structure and a way to filter down to a subset of the structure.
You open the CBS tree slide out panel by clicking on the CBS Tree icon on the Side Toolbar.
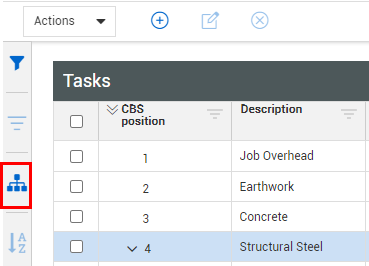
When selected, the CBS tree icon turns yellow and the slide out panel appears.
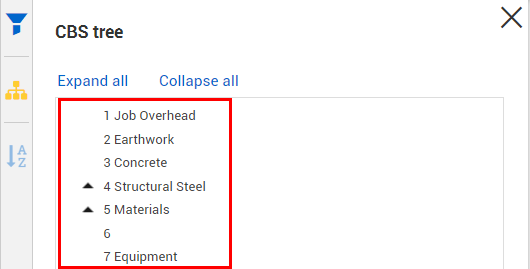
Select Expand all to expand the entire Cost Breakdown Structure
Select Collapse all to collapse the entire Cost Breakdown Structure
Click on the arrow icons to expand a cost item to view its subordinates
Select a cost item and then click Apply to filter your view to that cost item and its subordinates
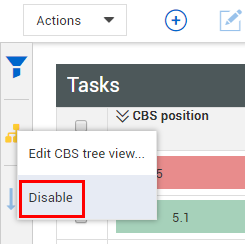
To clear the CBS filter, click the CBS tree icon and then click Disable
You can select more than one cost item on the tree to create a customized view.
You can access a variety of cost item details and actions from the Cost Item menu.
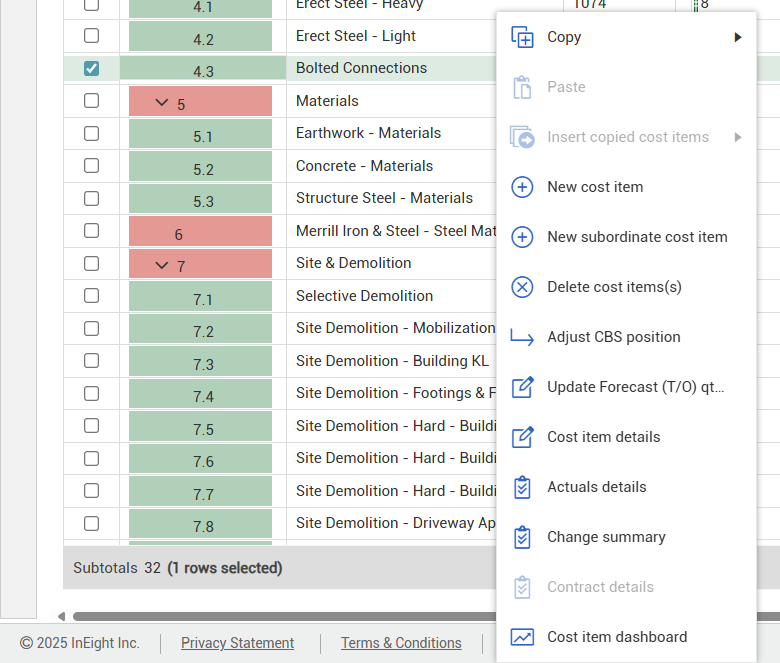
You can open the Cost Item menu in one of two ways:
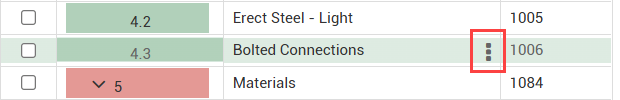
Right-click the cost item
Click the three vertical dots in the Description column
The following table provides details for the options in the Cost Item menu.
|
Option |
Details |
|---|---|
|
Copy cost item |
Copy the selected cost item with its associated resources. |
|
Copy selection |
Copy the value from a specific cell. |
|
Paste |
Paste the copied content. |
| Insert copied cost items | Insert the copied cost item in a CBS position that is above, below, or subordinate to the selected cost item. |
| New cost item | Create a new cost item. |
| New subordinate cost item | Create a new cost item that is subordinate to the selected cost item. |
| Delete cost item(s) | Delete the selected cost item. |
| Adjust CBS position | Move the selected cost item to a new position in the CBS. |
| Update Forecast (T/O) qty with Plan component total qty | Copy the total quantity of the associated component in InEight Plan to the Forecast (T/O) quantity of the selected cost item. |
| Cost item details | Open the Cost Item Details slide-out panel, where you can manage the cost item. |
| Actuals details | Open the Actuals Details slide-out panel, where you can input claimed quantities and view actuals history and commitments. |
| Change summary | Open the Change Order Details slide-out panel, where you can view associated change orders, the budget change summary, and the change order summary. |
| Contract details | Open the Contract Details slide-out panel, where you can view associated contract details from InEight Contract. |
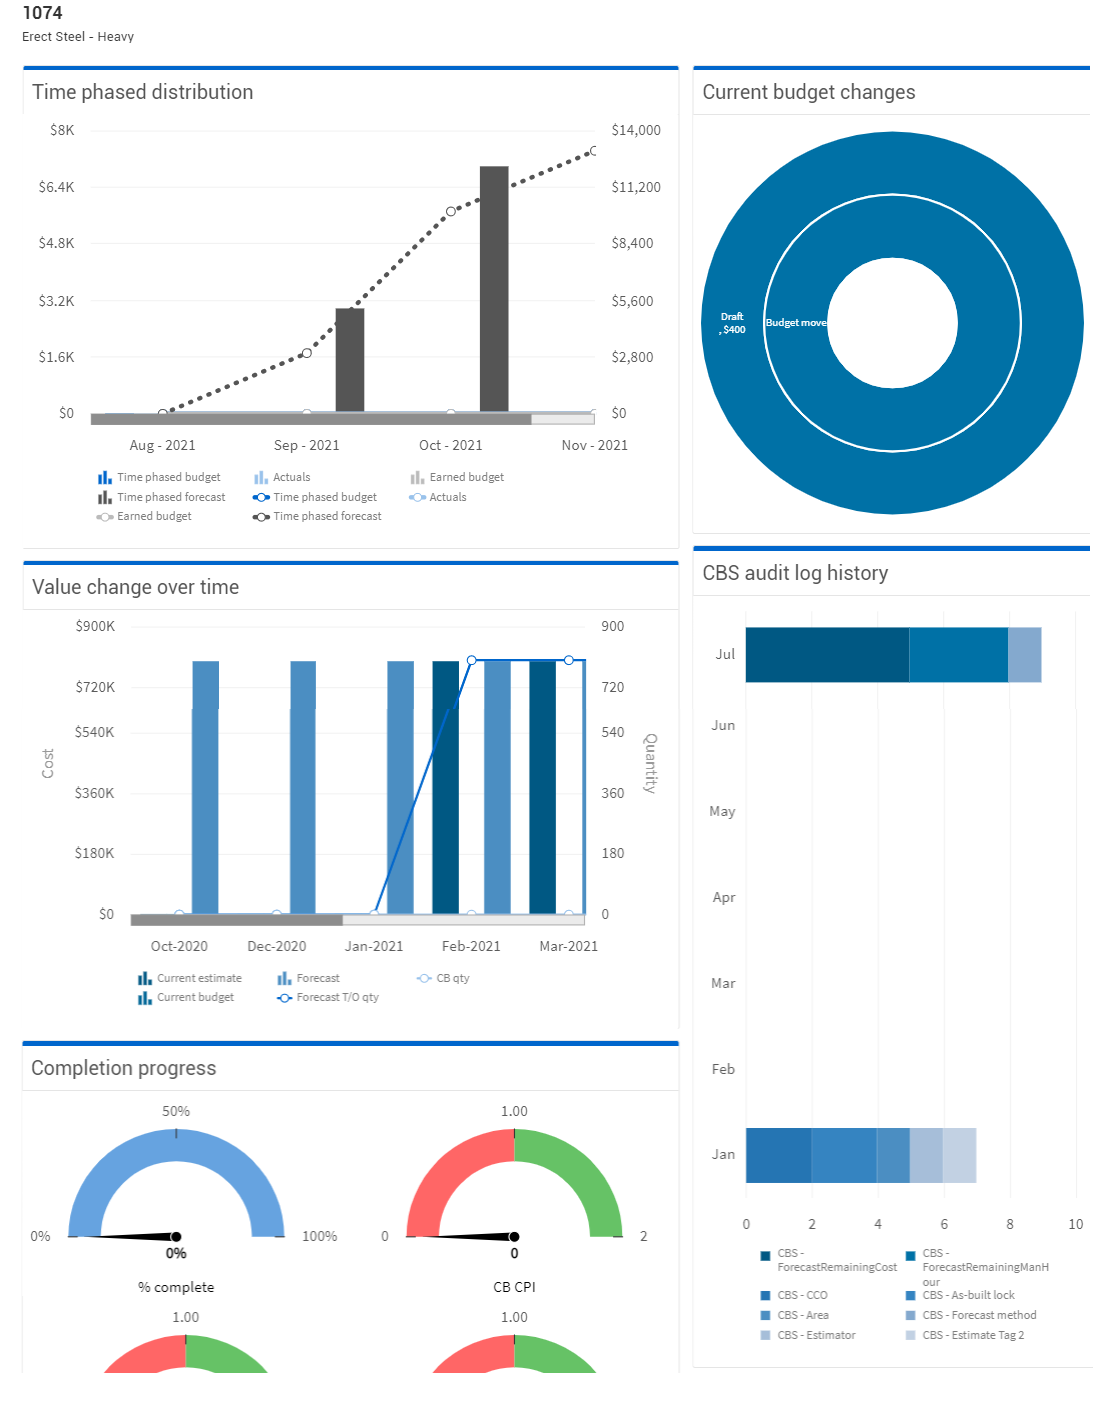
| Cost item dashboard | Open the Cost Item Dashboard slide-out panel. |
The Cost Item Dashboard slide-out panel shows multiple cost item affiliated graphs. These graphs let you further analyze cost item past and current performance trends related to time-phased distribution, current budget changes, value over time, completion progress indicators, and a CBS audit history log.
Additional Information
9977 N 90th Street, Suite 250 Scottsdale, AZ 85258 | 1-800-637-7496
© 2024 InEight, Inc. All Rights Reserved | Privacy Statement | Terms of Service | Cookie Policy | Do not sell/share my information